Version 112
🗓️ Date: 22 May, 2024
✨ New features
-
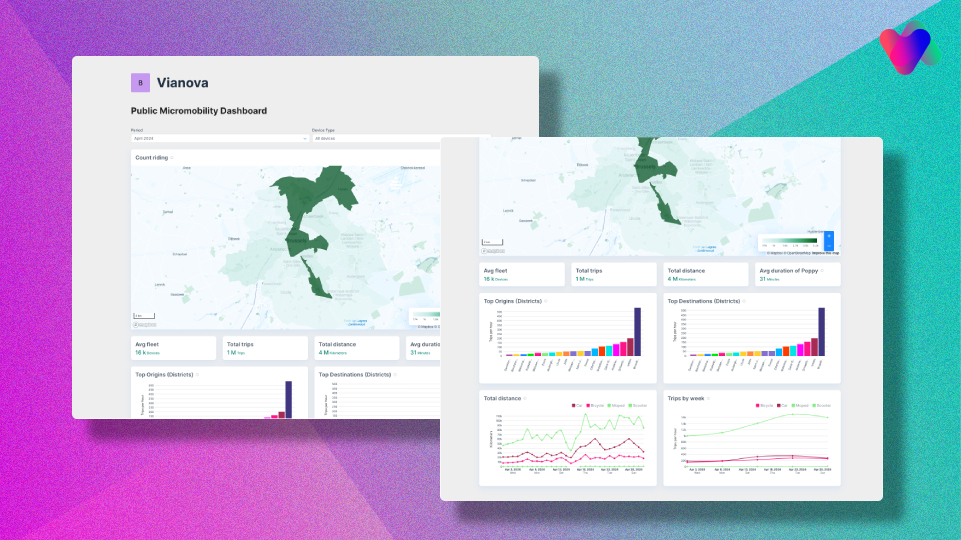
[REPORTS] We are excited to announce the launch of our new Public Micromobility Dashboard. Previously, our reporting capabilities were somewhat limited in terms of accessibility and dynamism. We recognized the need to enhance both functionality and user experience, and the result is an intuitive dashboard designed for the general public, featuring clear navigation and easy-to-understand visuals.
The new dashboard addresses the growing demand for public access to dynamic insights into city mobility data, specifically focusing on micromobility. It integrates interactive maps that provide visual insights into mobility patterns, traffic conditions, and more, making it a powerful tool for anyone interested in urban mobility trends.
Users can explore data snapshots that are available for every device type on a monthly, quarterly, and yearly basis. The dashboard automatically updates with new snapshots at the start of each month, quarter, and year, ensuring that the data remains current and comprehensive.
One of the key advantages of our new dashboard is its accessibility. Anyone with the URL can access it without needing an account or having to log in. Additionally, the dashboard operates with no execution cost since all data is pre-computed, eliminating the need for API calls. This not only ensures a smooth user experience but also allows for a potentially larger audience to benefit from the insights provided.
We believe this new Public Micromobility Dashboard will significantly enhance how the public interacts with and understands urban mobility data, offering a seamless, informative, and engaging experience.
🛠️ Cityscope Improvements
-
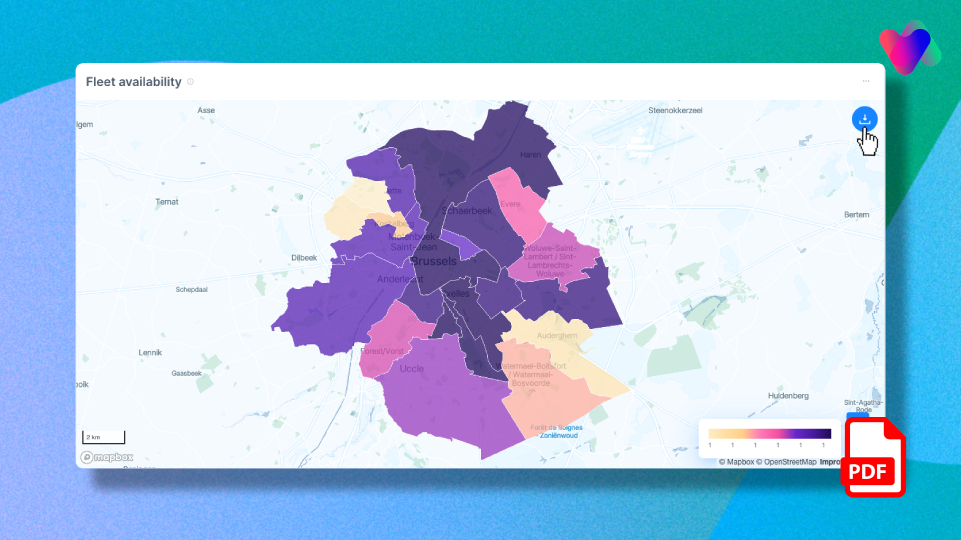
[REPORTS] With the latest update, users can effortlessly convert their interactive maps into high-quality PDF documents. This is particularly useful for creating reports, presentations, and documentation that require a static format.
🚧 Bug Fixes
- [REPORTS] Fixed possibility to re-name the title of the controller that is used for filtering data on Activity page for custom data sources through Vianova’s back office tool
- [REPORTS] Fixed a regression which caused that the changed date-range wasn’t properly applied in the query definition when creating new widget or entering an already-existing widget
- [CONTROL] Fixed an issue which caused that the table of devices present on the screen resulted by default to the page number 2 instead of page number 1
- [CONTROL] Addressed a bug where users were unable to open any other new vehicle popups if they did not close the current vehicle detail popup before attempting to open another one
- [REGULATIONS] Fix for the filter status including 'Not Active Yet' option twice even after previous fixes in version 102
- [REGULATIONS] Fixed a problem where zones of the regulations that were too small were changed in shape after they were saved into the system, causing distortion of the initial shapes as drawn or submitted by the users
- [SYSTEM] Corrected an error that was raised during stream upload process if the data source included two identical data columns
- [SYSTEM] Fixed a bug that was causing that specific data columns from the data source were incorrectly identified as date-time columns during stream upload.
- [SYSTEM] The language choice for Norwegian is now appropriately interpreted; previously, it was labelled as "false" since it was lacking its name as a result of regression
- [SYSTEM] Fixed an issue that resulted in the trip related Shared Mobility data momentarily having twice as much value. All of the data were instantly backfilled with the correct values\
📝 Documentation
- Our Help center guide will always help you to get started with us [🔗 Vianova Help Center]
As always, our teams are at your disposal to help you get started with these features, so don't hesitate to contact us directly online by chat or by email at [email protected].
Getting started with Vianova → https://help.vianova.io/