Better Analysis Through Reports and Zones
Zones: Analyze Any Geography
Custom Zones are a powerful way to do on-the-fly analyses of areas that interest you.
You can create Custom Zones in the same way you add regulations. You can draw freehand, use prepared shapes such as rectangles or circles, or upload your own GeoJson.

As zones are added to the map, you'll see them appear in the table in the left sidebar. Here you can give each zone a unique name (ex. the intersection, transit station, or relevant administrative region it represents). To group together zones, Cityscope provides a tagging system. You can add as many as you want. Cityscope provides a number of standard tags to choose from (ex. Study Area, Admin boundary), or you can create your own custom tags to create logical groups (ex. Mobility hub, Parking study, etc.).

Once you've saved the custom zones, the insights happen on the Activity page. Open Activity and select one or more zone tags to add them to your activity screen. You will see a number next to each tag, indicating the number of zones that are presently in that group.

You can conduct all the same analyses using Activity that you have previously been able to do for districts and subdistricts. You can select all of the shapes within the same feature, or a single feature to drill in further.

"Zone Zooms" and Origin & Destination Flows
Zones are especially useful to drill down on the popular trip patterns between geographies.
Clicking on the blue arrow next to a zone name (a district, subdistrict, or any custom zone) brings you to the "Zone Zoom"

The blue arrow appears when you hover over the name of a zone
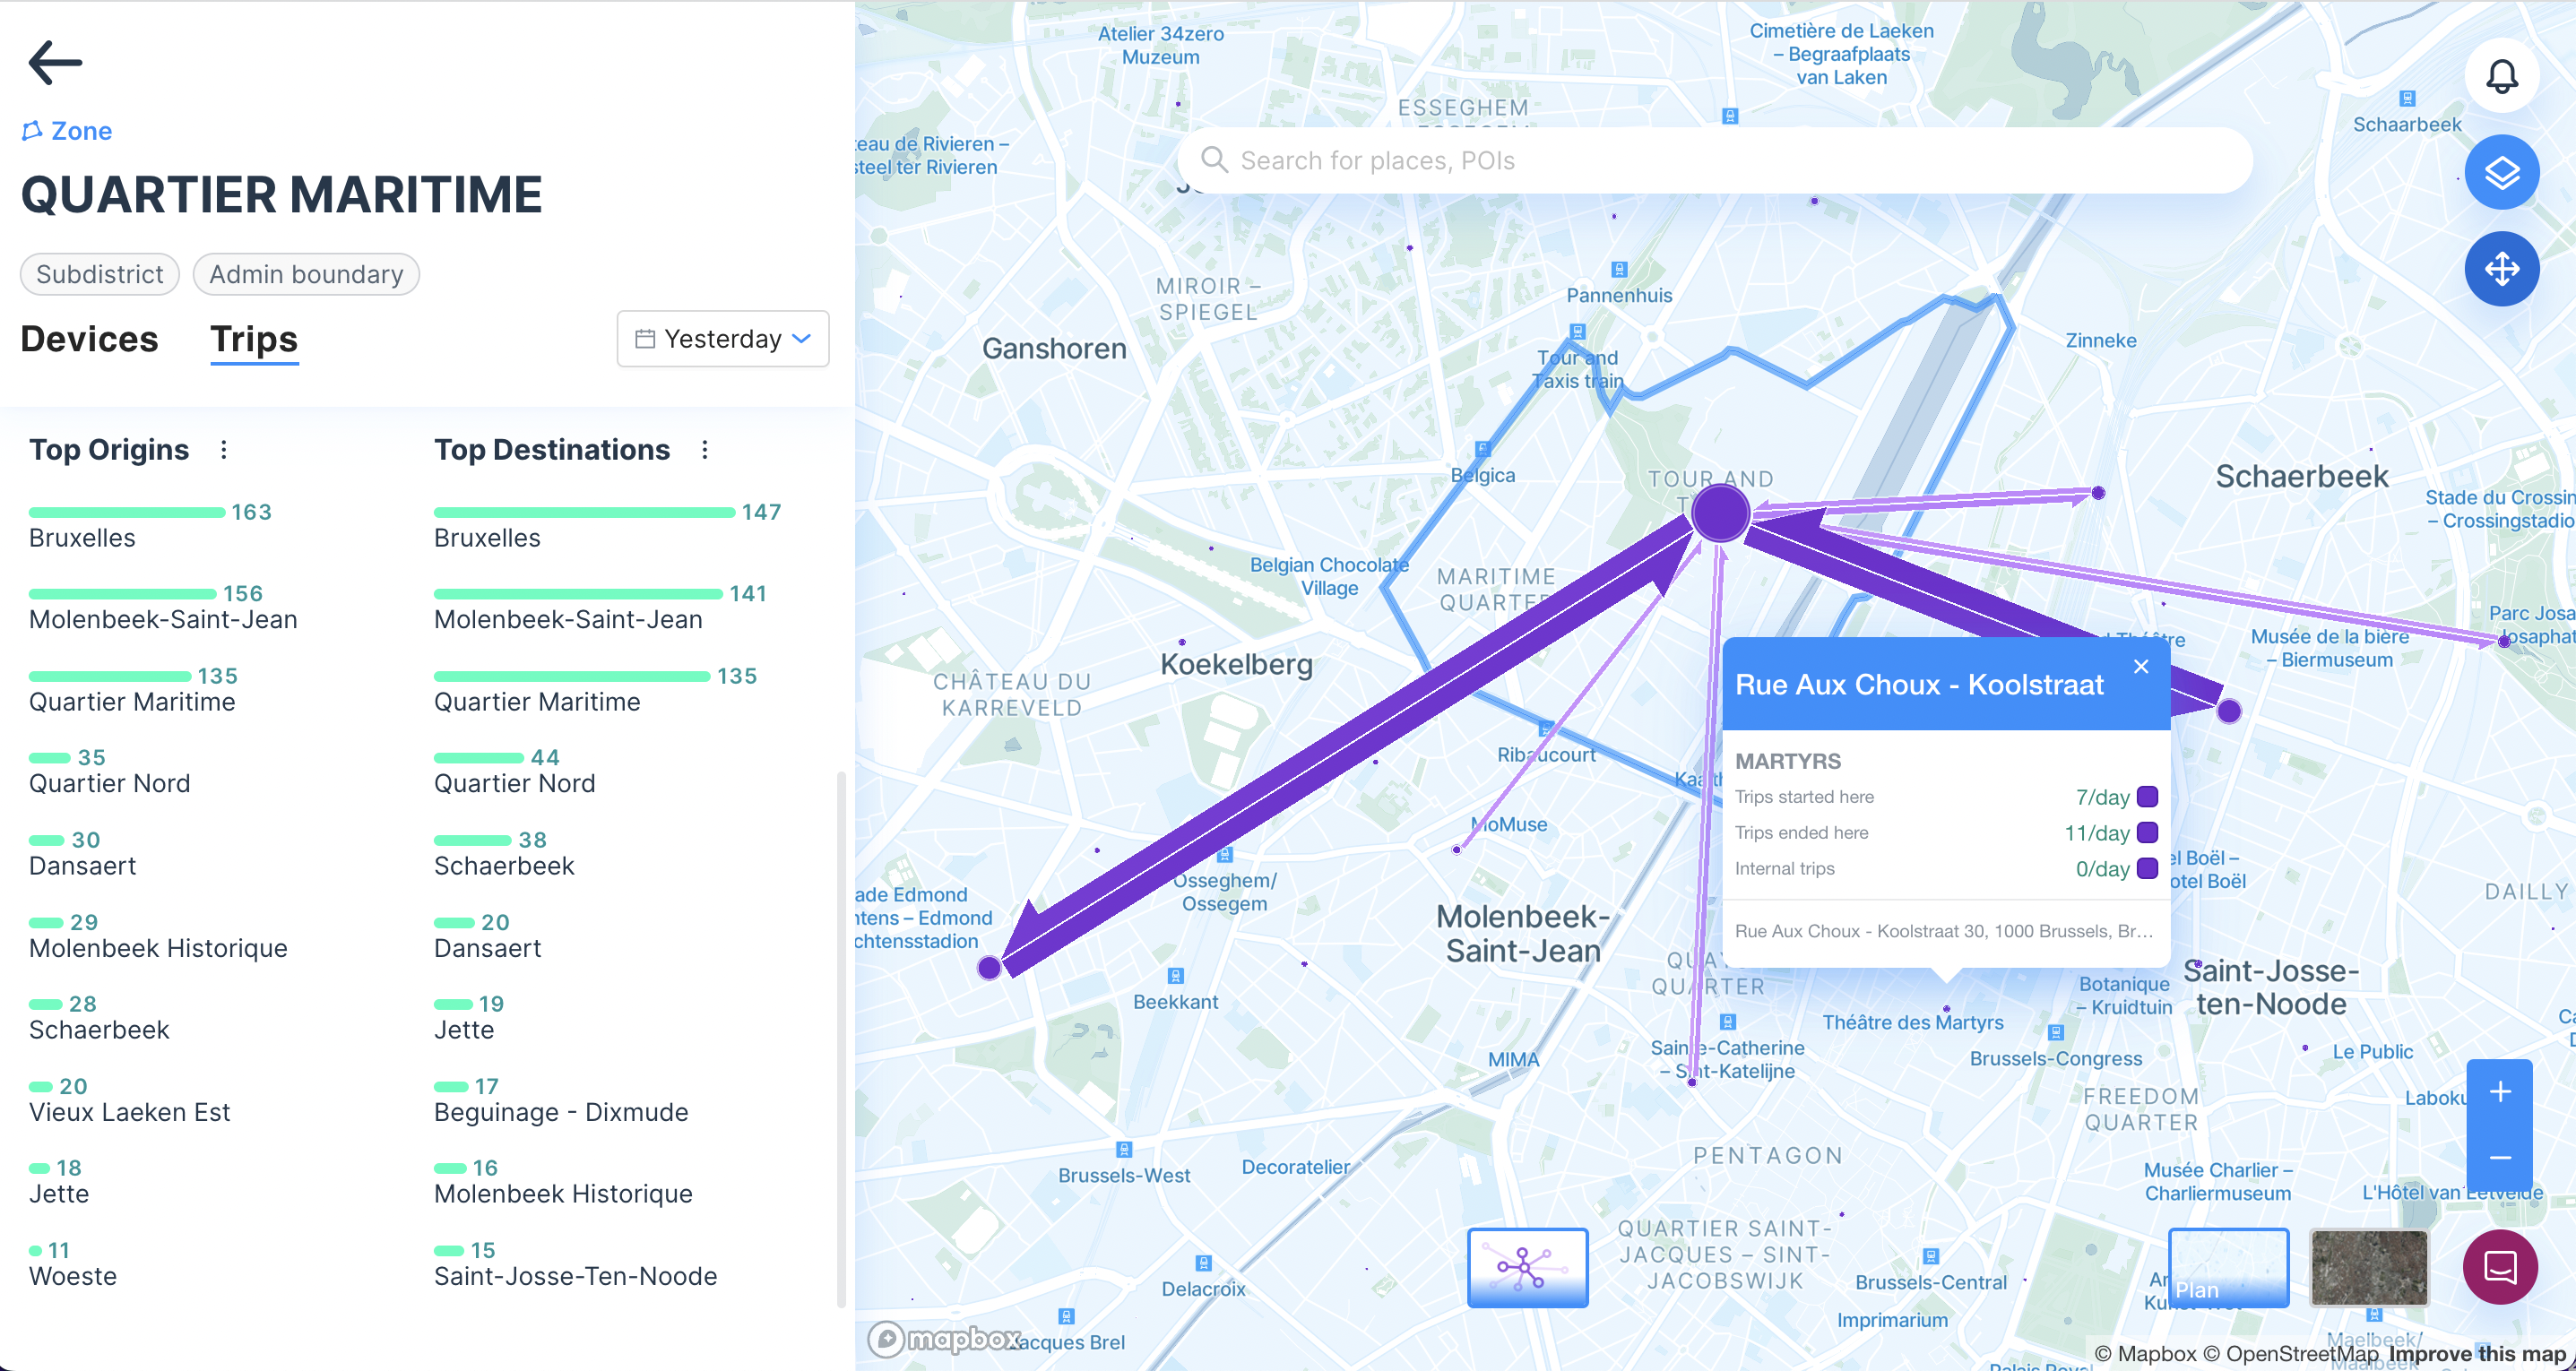
This experience will give you the ability to better understand patterns on any one zone. This is particularly true if you switch to the "Trips" view, where you can see the most popular origins of trips which end in that zone, or the most popular destinations of trips starting in the zone. This number can be represented either as a total count, a daily average, or an hourly average. The data is also exportable via a CSV.
Videos and Additional Resources
Updated 8 months ago