The Report Page
Introduction to the Report Page
Report is a feature enabling users to track metrics over time. Metrics can be evaluated based on either zones (citywide, district, subdistrict, or custom zones), or on existing policies (either a specific policy, or all policies of the same type).
Who is the Report Page for?
The Report page is ideal for people who are taking a long-term view on the success of the mobility program. Virtually any metric can be viewed over a period of time. Any report can also be simply printed or the link shared to others using the Cityscope platform.
How to Use Report
A report is made up of several widgets. Each report can have a single time range, which is either static:

or dynamic based on the day you are using it:

Depending on the time range that you decide to select, the data will be calculated in a bit different manner:
- When selecting the absolute date not including today, the average will be calculated on 00:00 to 00:00 the next day (local time)
- When selecting the absolute date including today, the average will be calculated on current time, for example if now it is 14:43, the average will be 15:00 to 15:00 the next day
- When selecting the relative date, the average will be calculated the same (current time) but for 14:43, the average will be 14:00 to 14:00 the next day
Widgets can be created for either Regulations (no parking, fleet caps, etc.) or for Zones (analytics such as trip counts, device availability, etc.). For Regulations, you have the option of either selecting all of the regulations of a single type (for example, all no parking zones in your city), or one single regulation (for example, a no parking zone around the town cathedral).
For Zones, you have the option of selecting the entire city, or a particular layer of custom zones that you have designed (for example the areas around metro stops).
"Group by" allows you to bucket data by provider (one line/bar per operator), device type (one line/bar per vehicle) or zones (one line/bar per geographic feature, for example per metro stop)

In the second step, you can modify the metric type (for Regulations, always the average infringements per hour; for Zones, a range of different metrics such as fleet size, average duration, etc.). You can read more about the different metrics in our metrics dictionary.

You can also adjust the resolution of the data (how many data points show) to be one data point per hour, per day, or per week). If you select "all" as your resolution, data will be bucketed over the entire period of your report. For example, if you are sorting data by a custom zone with metro stations, you will see the number of trips by metro stop, as seen in the sample widget below.

In the final step you can modify the name of your chart and then publish it! *But only when you choose a static date range, this option is not available with a dynamic range set up

After a widget has been updated, you have the ability to change how it is presented in the report. Selecting the cog icon in the top right of a published report will allow you to adjust its presentation, including bar charts, line graphs, and tables.

Infringement table
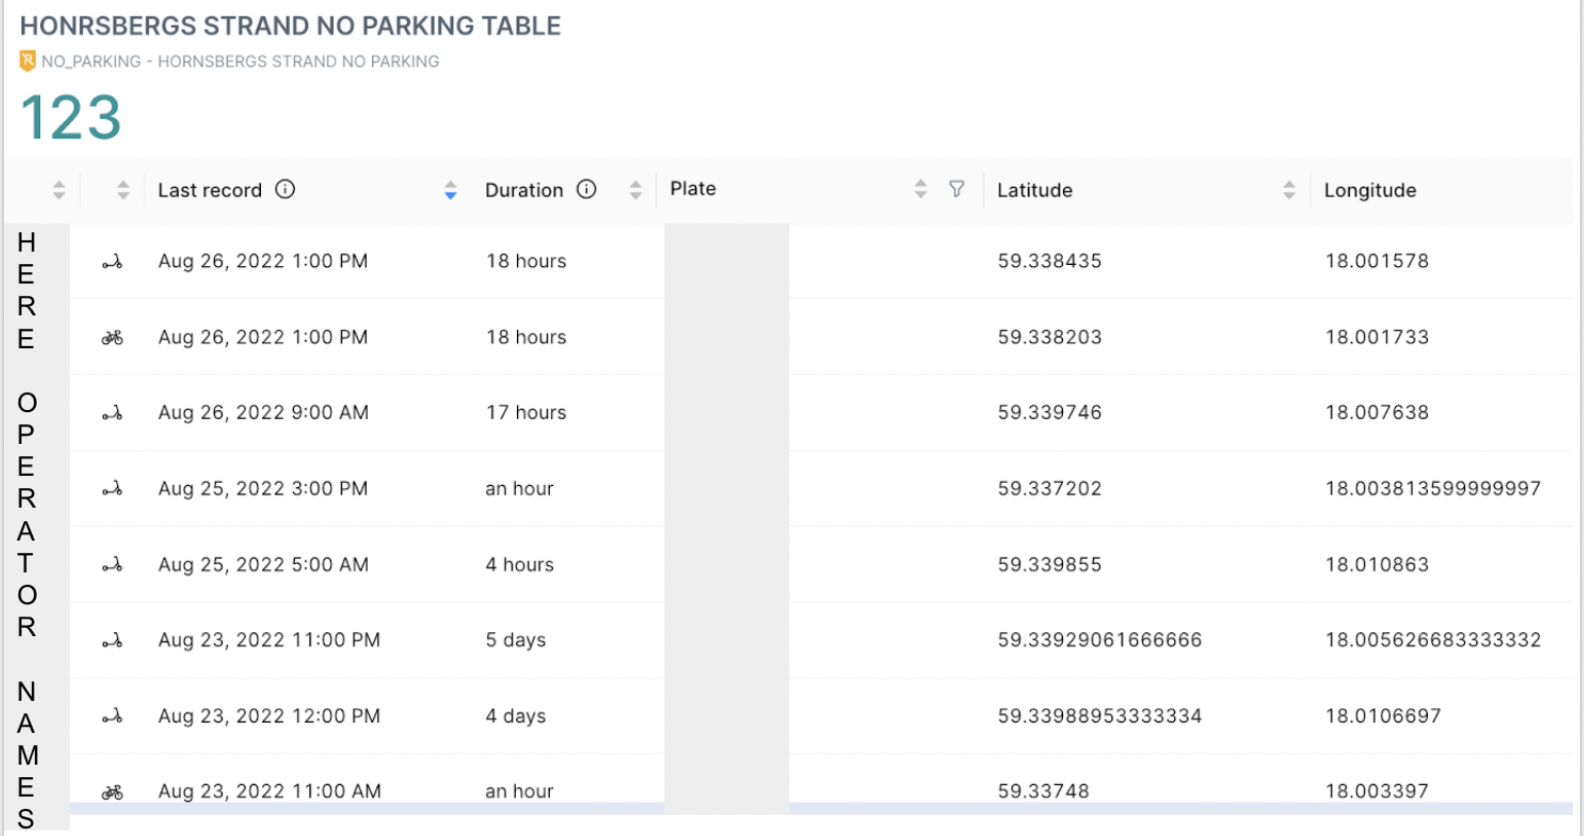
The infringement report allows you to generate a list of vehicles that are infringing regulations set up in Cityscope. As shown in the following view, you will have different information that you can filter on. By hovering over the titles line, different tooltips will guide you, and you can of course refer to our definitions and calculation rules to help you target the right information.
Infringements are calculated at an hourly basis- in other words, we check the position of the device against the map of policies every hour. Data in the report will show infringements which:
- Last for at least one hour
- Were in infringement no more recently than two hours ago
The “last record” indicates the most recent hour in which the device was logged in infringement. In the case of historic infringements, this can be thought of as “when the infringement stopped”. In the case of current infringements, this can be thought of as “the last time we know the device was in infringement”. See the table below:
| "Last Record" | "Duration" | |
|---|---|---|
| Infringement happened in the past | The end date of the infringement | The number of hours or days between the start of the infringement and its end |
| Infringement is currently happening or happened in the recent past | The most recent hour when Cityscope can say for certain the device was infringing | The number of hours or days this device has been in infringement so far |
Some key points to note in order to be able to generate this report :
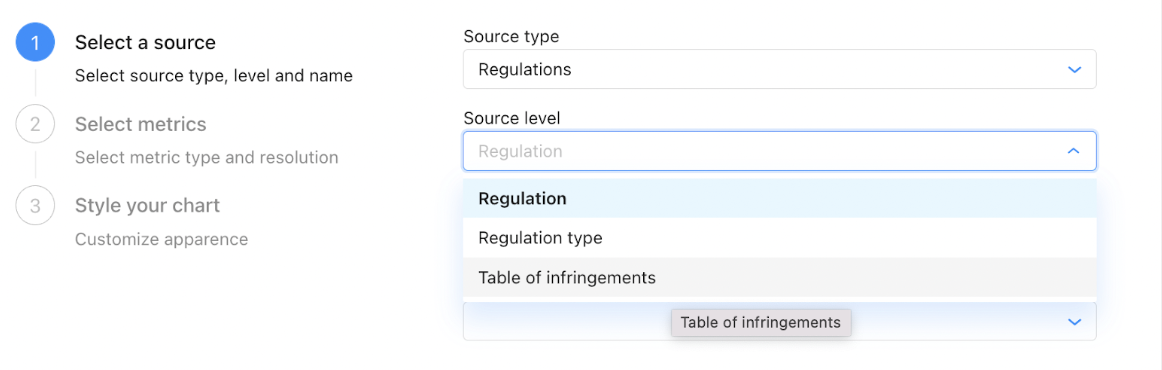
- When you start creating the report by adding a new widget in your report page, select the "table of infringement" as source type / source level
- Then define the policy to query..
- You must select one policy per infringement table, and infringement tables can only be created for No Parking, No Go, Max Unavailable, or Max Parked policies (policies that are calculated on a device level, rather than a fleet level)
- Like all our other reports. we can also offer you the possibility to download the data present in the report.
To view real-time infringements (infringements happening within the last few minutes), visit the Control page. The map will show you the locations of those devices currently in infringement.
Publishing a Report
Reports contain insights that are often relevant beyond the primary users of Cityscope. In order to convey this information to colleagues without a Cityscope account, elected officials, concerned citizens, or the public at large.
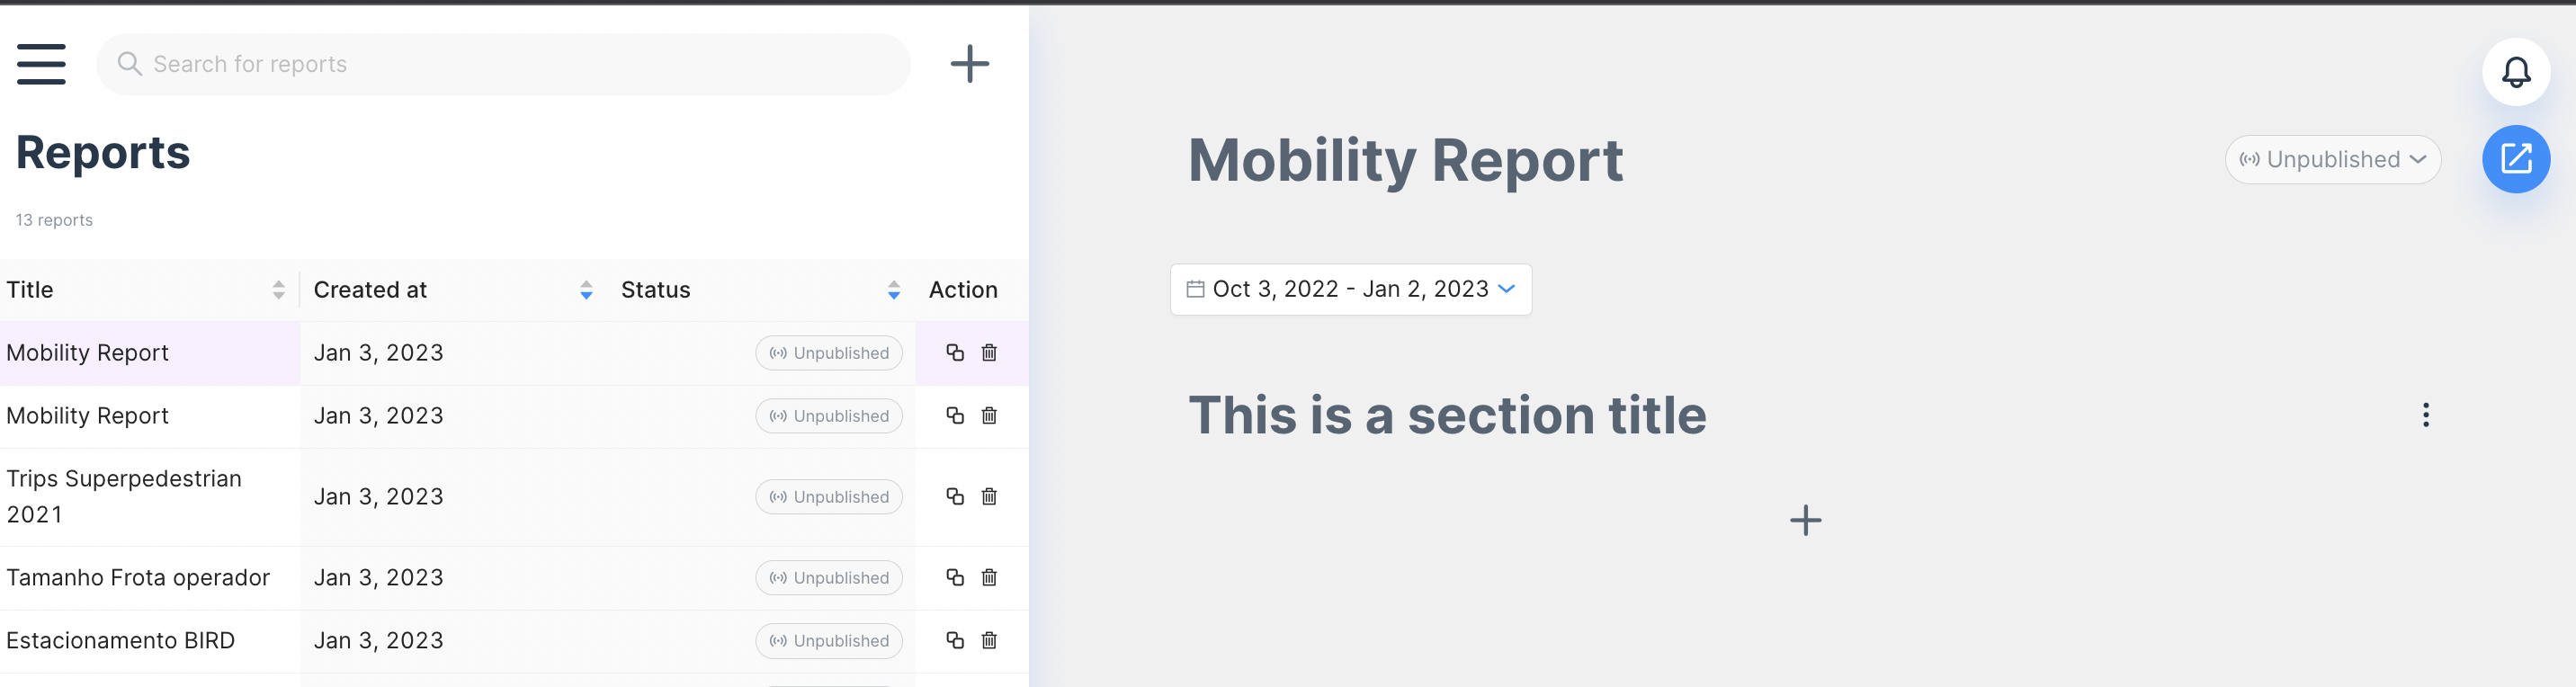
After they are created, all reports are "unpublished" by default, which will be indicated by a grey pill in the "status" field.
There are two ways to publish a report. You can publish a custom report or create an anonymised public dashboard accessible to anyone with the right link.
Publishing a Custom Report
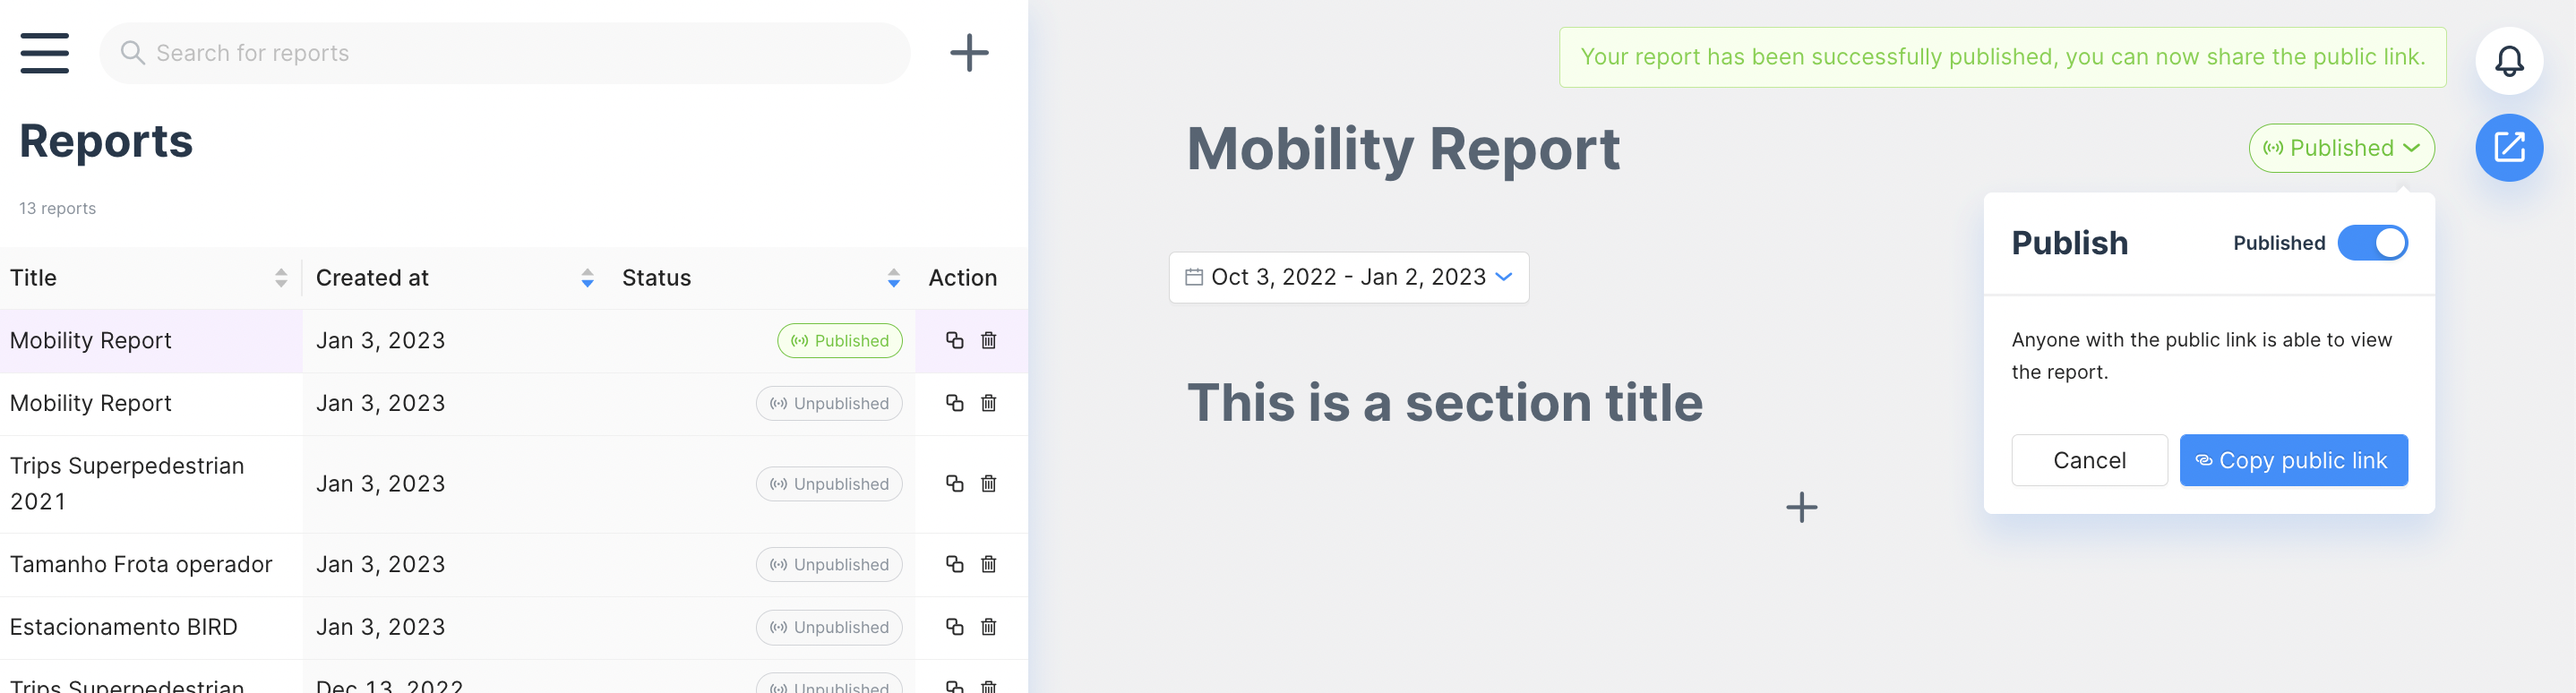
Select the icon in the top right and switch from "unpublished" to "published". A unique URL will be provided, which can be accessed by anyone with the link. By "unpublishing" the report again, the link will no longer function.
Published reports must have a fixed time range (ie, both a start and end date), reports with relative date ranges, such as "the last 7 days" cannot be made public.
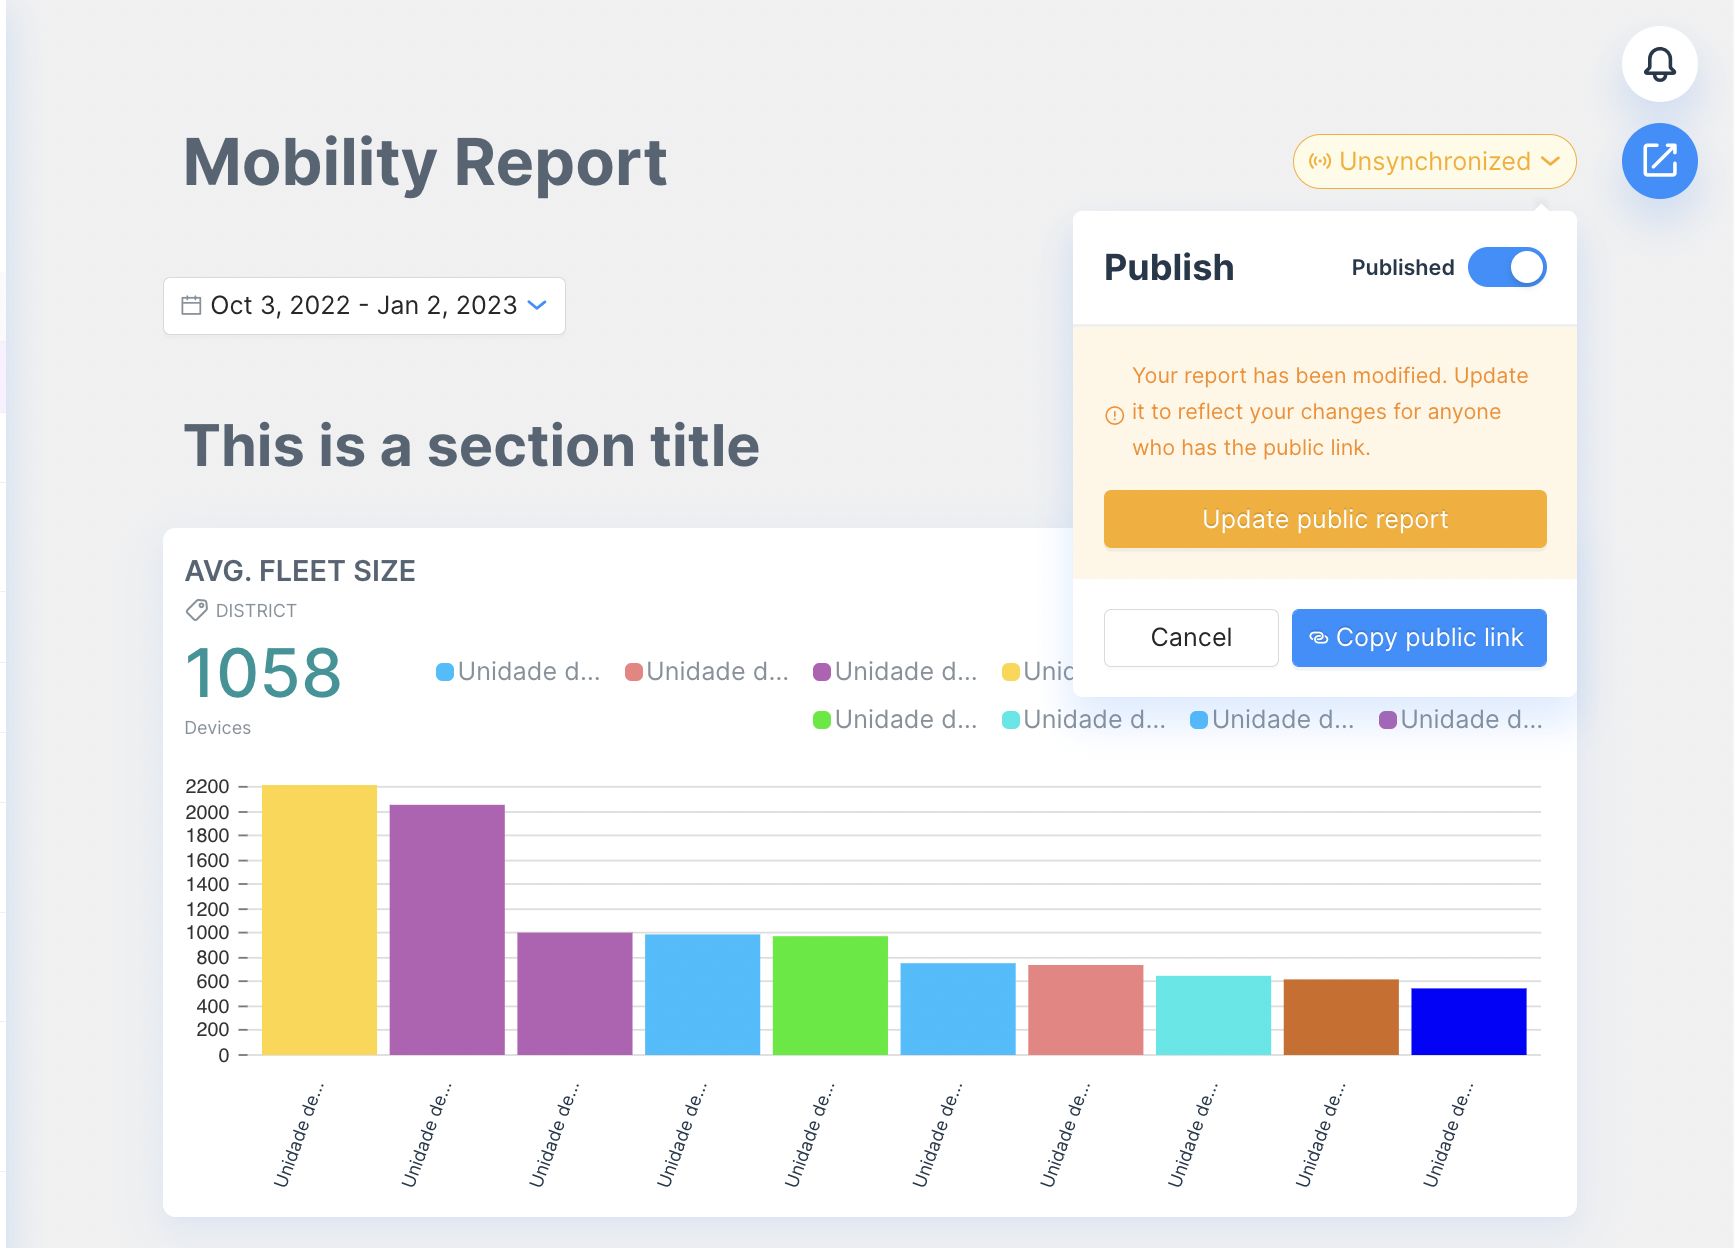
If any changes are made to the contents of a report, the icon will switch to "unsyncronized", prompting you to refresh the public report in order to mirror the content of the internal version of the report.
Creating a Public Dashboard
Creating a public report template is a three click process - and you can share the link with the public or stakeholders in the city without a license.
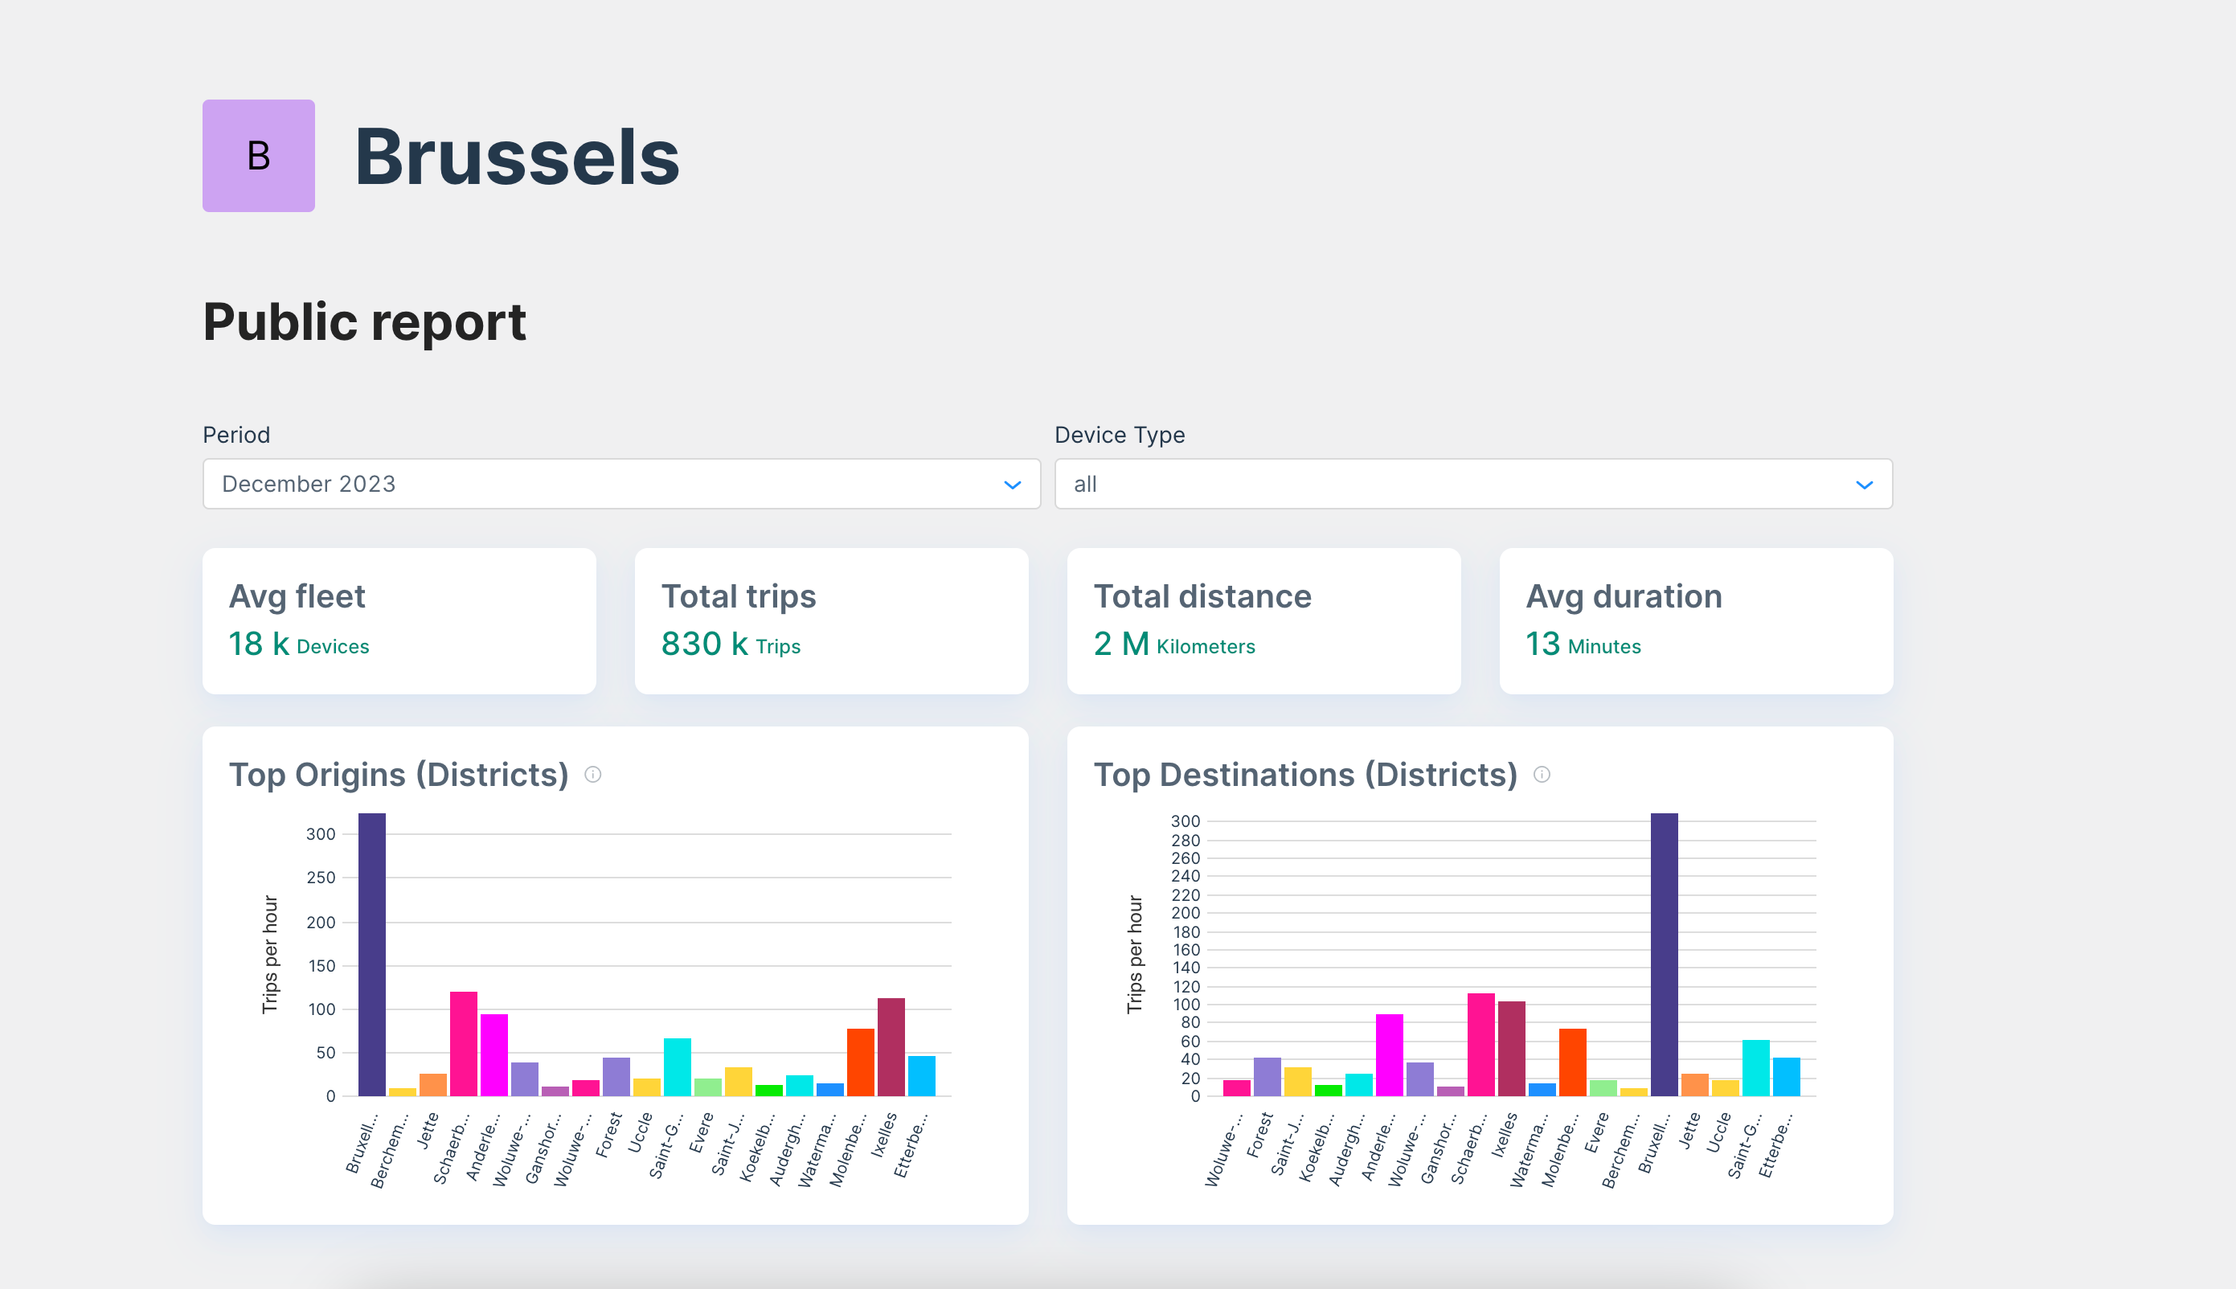
All data included in this dashboard is anonymized and aggregated consistent with our GDPR policies, so you are able to share data simply and safely.
Please note that the standard public report contains extensive data, so it can take 40mn or more to load and show on your browser once it's been published.
Go through the process of creating a public dashboard with us in this product tour.
Video Resources
Updated 9 months ago