Custom zones from Activity
Create your own zones
Since Cityscope is a geo-analytics platform, one important thing for a user is the capacity to define the zone they would like to monitor.
Today there is actually 2 ways of adding new zones
- from the custom zone library, you will find all the details Zone library. Adding a new zone from the library is the best way to keep it over time and get historical insight but you have to consider that it will take multiple hours for the platform to calculate
- qualify a new zone directly from the Activity page
Example of custom zonesPlease find below some examples and illustration of custom zones
- As a transport planner, I want to monitor all the movement around my city central station
- As a mobility manager, I want to monitor the movement around a particular park in the city center
How to explore new zones from Activity
Please find the 3 steps to explore zones from the main Activity page
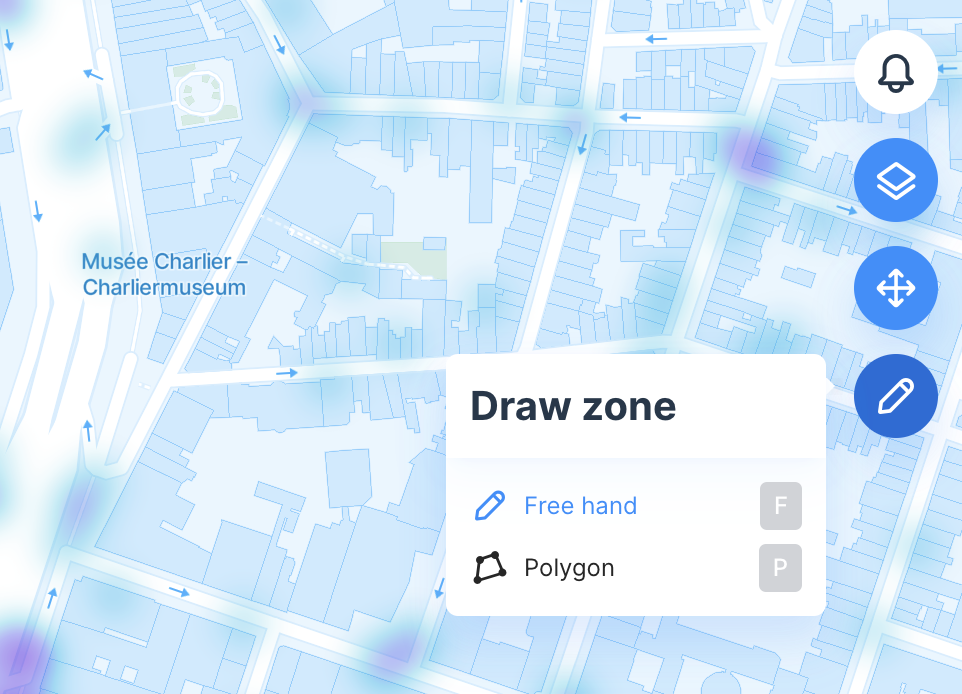
Draw the zone
By clicking on the pencil on the right top corner you will be able to draw your zone of interested directly on the map
Explore the main statistics
The platform will generate on the fly, one week of analytics based on the major metrics (ex: total devices, fleet availability) in order to give you a quick preview so you can decide to save this zone to your library.
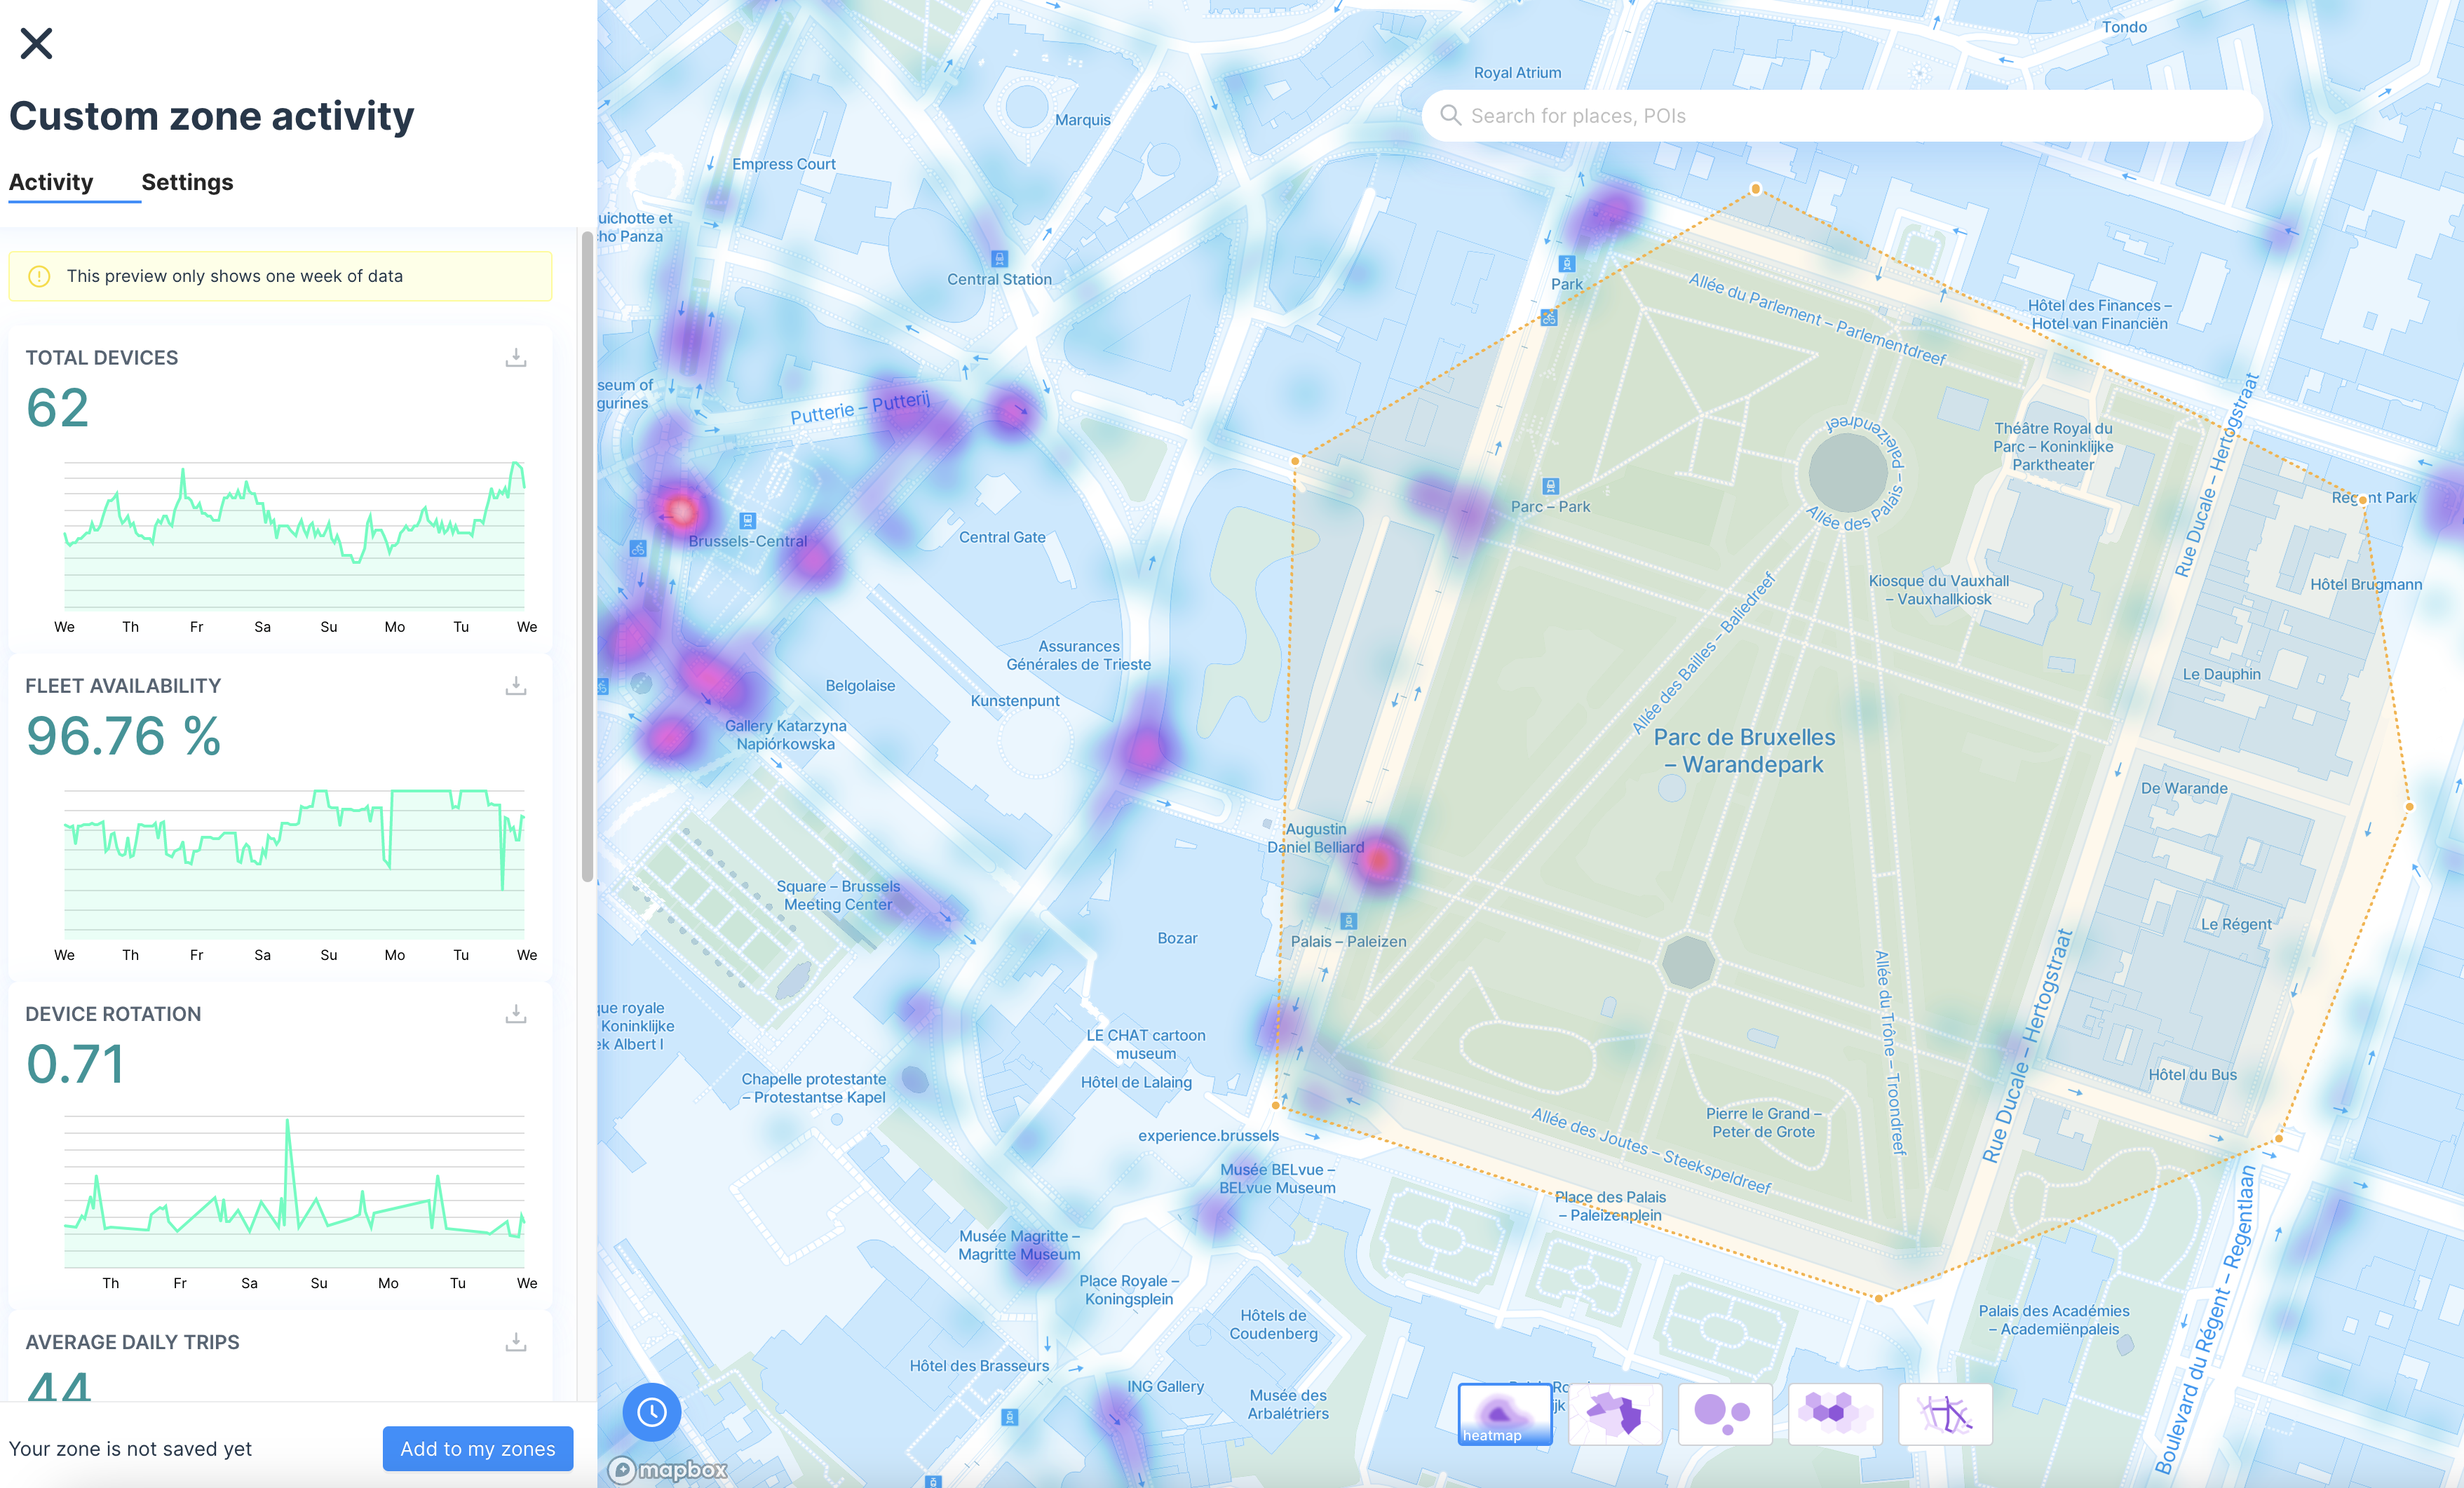
The main metrics for the last week from the custom zone
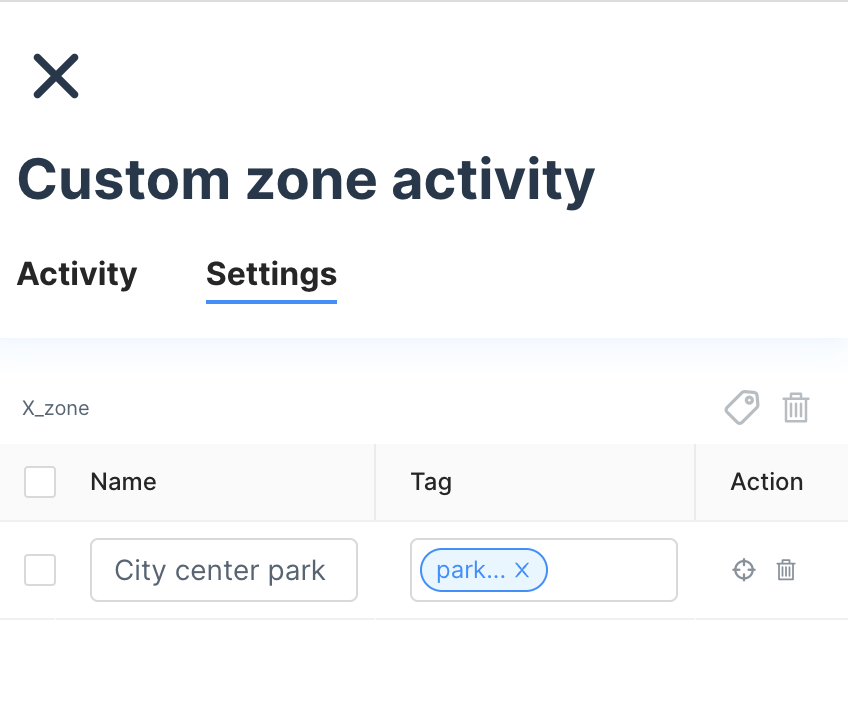
Keep it for later
The final step will be to input the settings, giving a name and choosing or creating a tag to attach the zone
Save it to your library
Backward metrics calculationPlease consider that adding a new zone to your library is immediate but it will take some time to calculate backward metrics from the last months.
Updated 8 months ago