Elements / Zone
Elements and zones in VIP allow you to define specific geographic areas for targeted analysis.
Overview
The VIP platform allows users to define and work with specific geographic areas through the Elements feature. This powerful functionality enables detailed analysis of data within customized zones or imported geographic boundaries.
Elements in VIP represent geographic boundaries such as districts, neighborhoods, infrastructure locations, school zones, or any other area of interest. They can be used to:
- Focus analysis on specific areas
- Compare data between different zones
- Filter visualizations to show only relevant information
- Create custom geographic boundaries for specialized analysis
Here is a full demo Video demo : Elements
Creating Elements
There are two primary methods to add elements to your VIP workspace:
Method 1: Import Existing Boundaries
Format : CSV with geometry, Geosjon, json
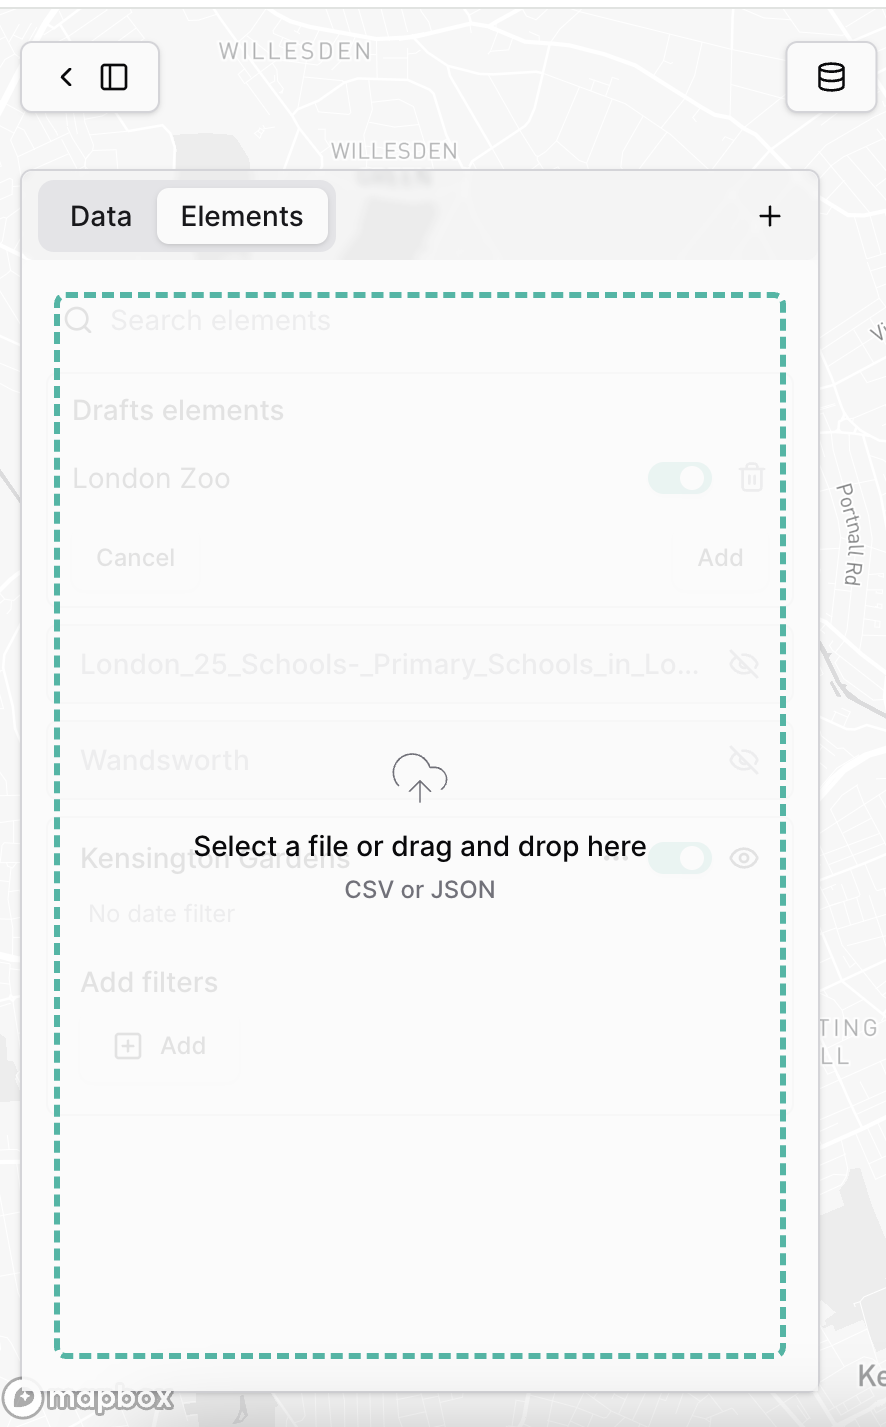
Navigate to the "Elements" tab in the left sidebar
Use the drag and drop functionality to upload a GeoJSON file containing your boundary data
Once uploaded, your element will appear in the elements list
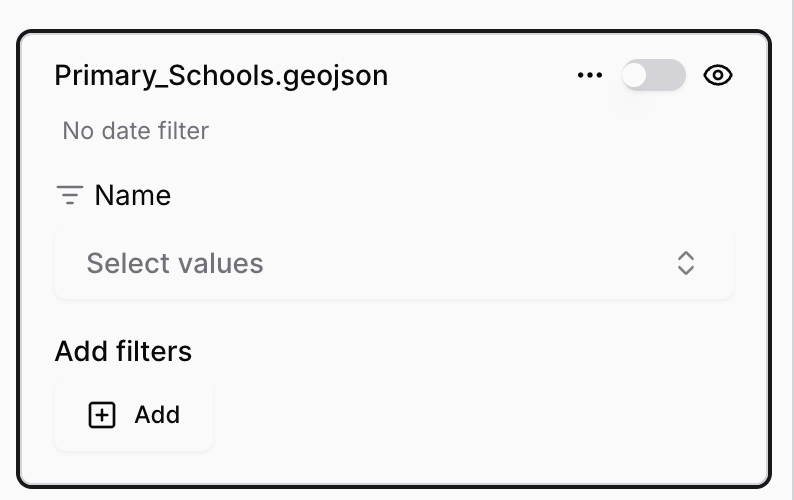
You can rename the element to something descriptive for your analysis
Method 2: Draw Custom Boundaries
Click on the draw tool icon in the top toolbar
- Select your preferred drawing method:
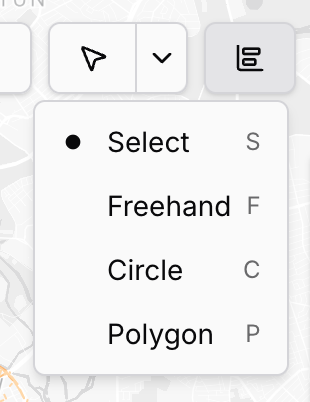
- Select (S):
- Click on existing features on the map
- Freehand (F): Draw a boundary by hand
- Circle (C): Create a circular boundary
- Polygon (P): Draw a multi-sided boundary
- Draw your boundary on the map
- Name your new element for easy identification
Managing Elements
Once you've created elements, you can manage them through the Elements panel:
- View/Hide: Toggle the visibility of any element using the eye icon
- Rename: Change the name of any element to better reflect its purpose
- Filter: Use the search function to quickly find specific elements
- Delete: Remove elements that are no longer needed
- Activate : Activate the element by clicking the toggle button next to its name
- Multi-Zone Analysis: Activate multiple elements simultaneously to compare data across different geographic areas
Analysing data within Elements
To analyze data within a specific element:
- Make sure your data layer is activated
- Activate the element by clicking the toggle button next to its name
- The platform will automatically filter the active data layer to show only data within the selected element
- The widgets will automatically be updated accordingly to the elements activated
- The date range of the activated data layer will be applied to the analysis
Example 1 : For instance here you can see a data analysis in Paris between the two Airports of the French capital.
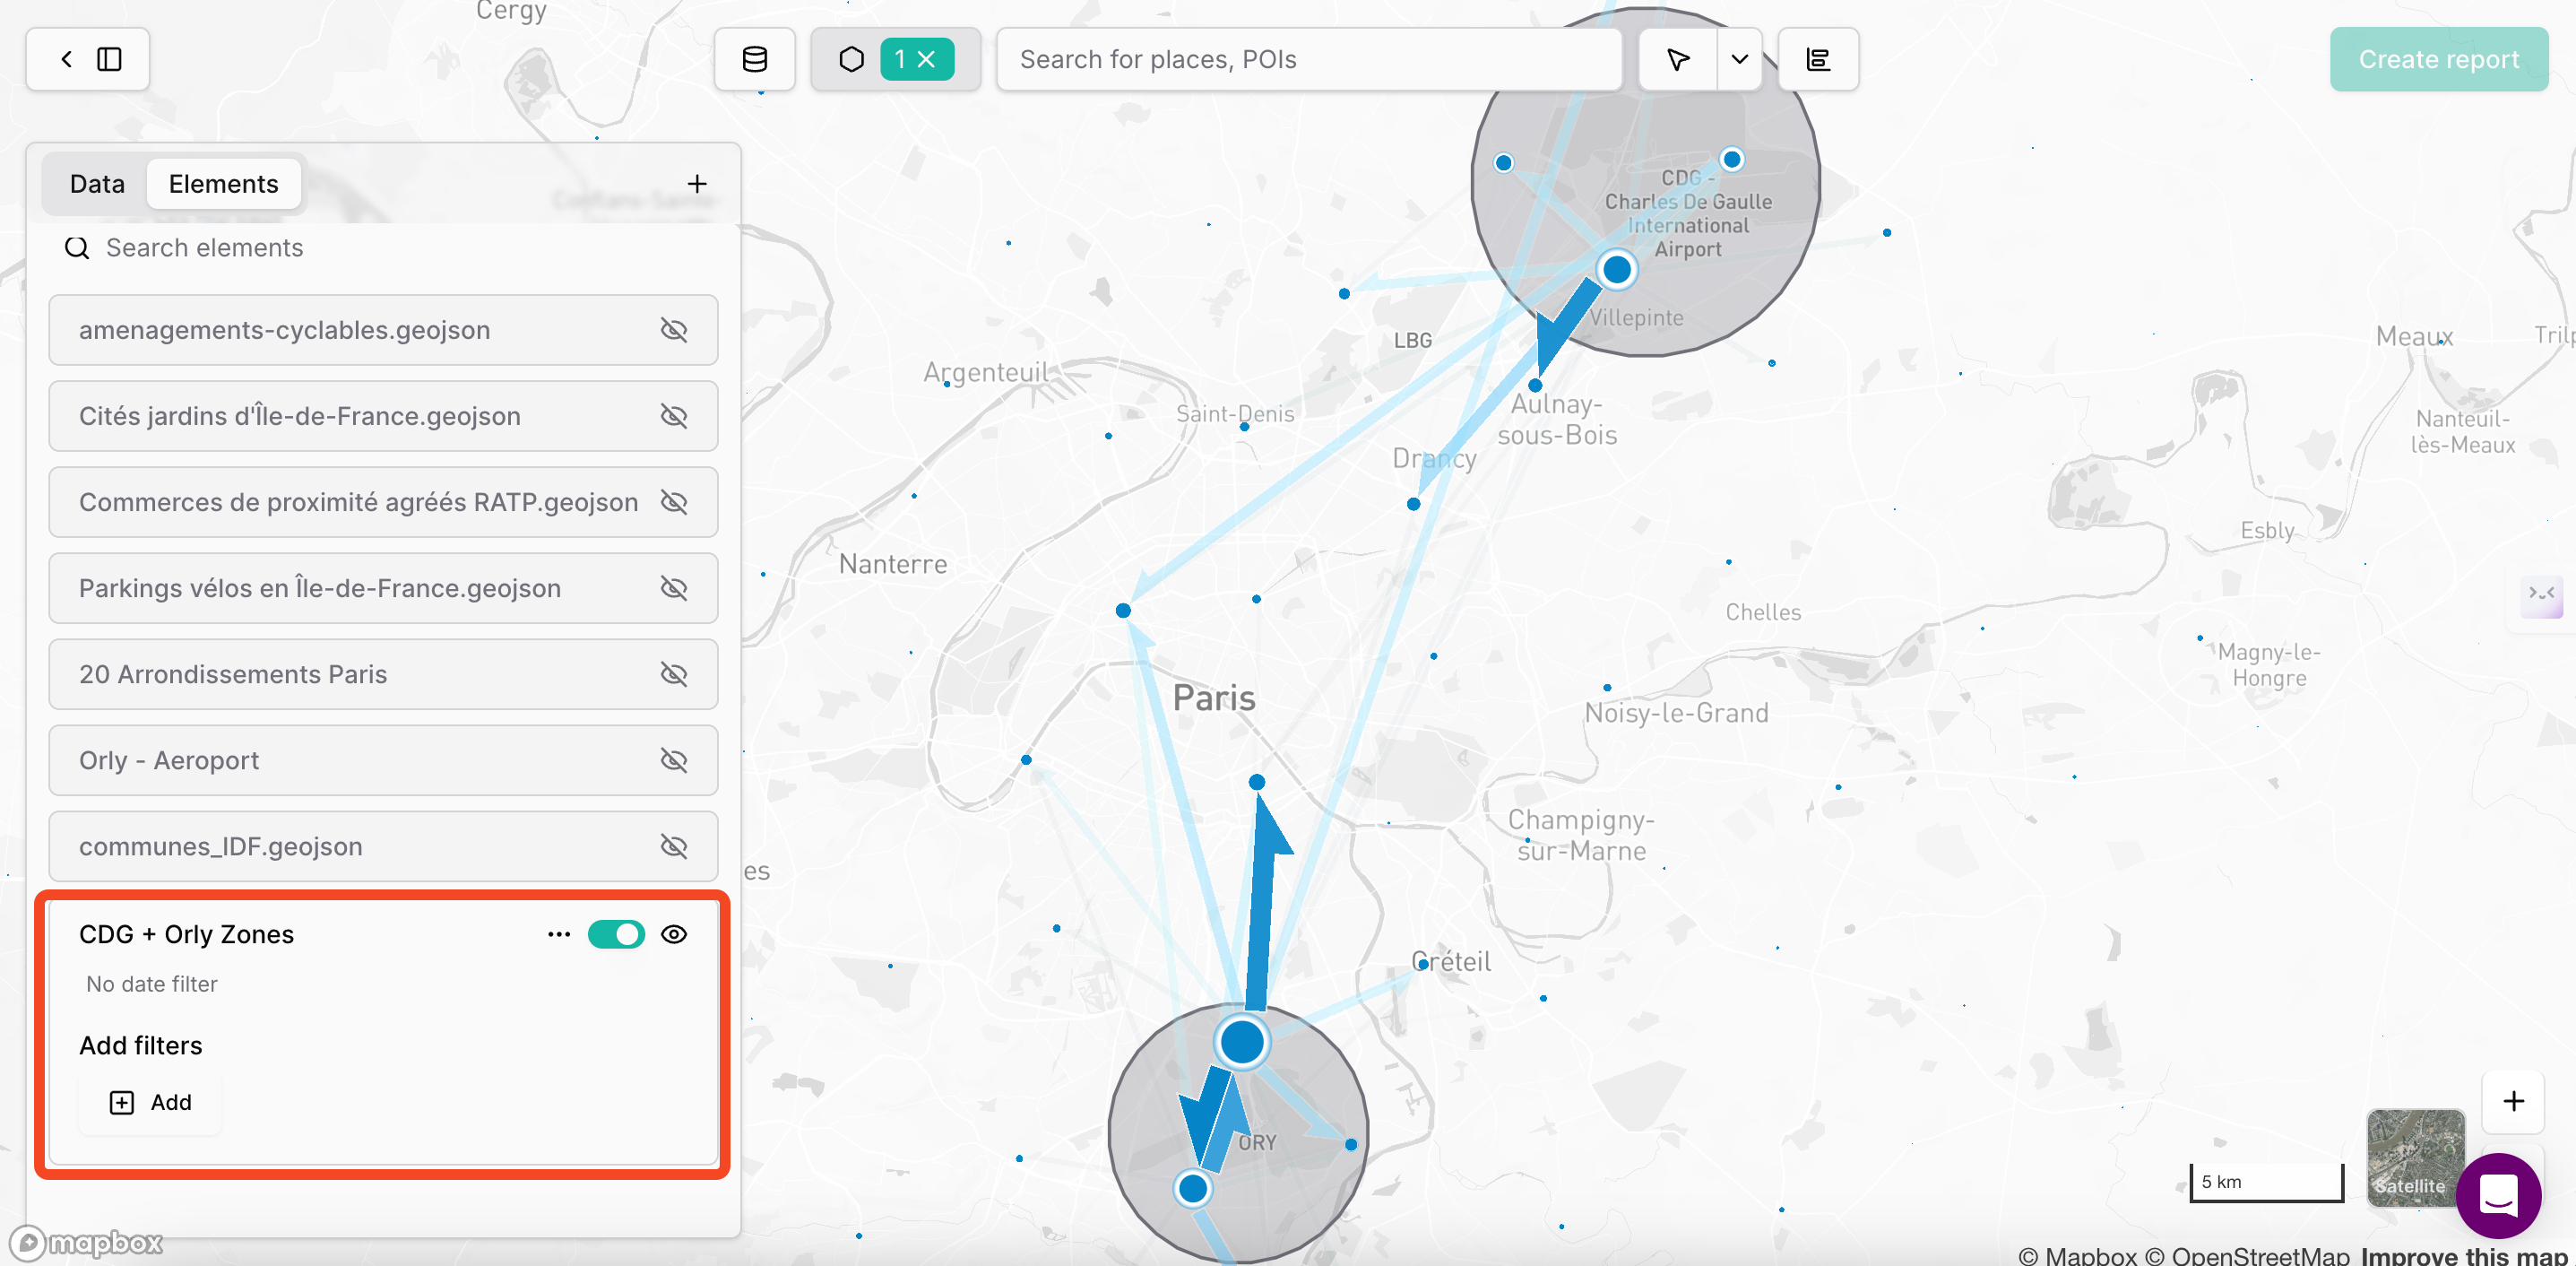
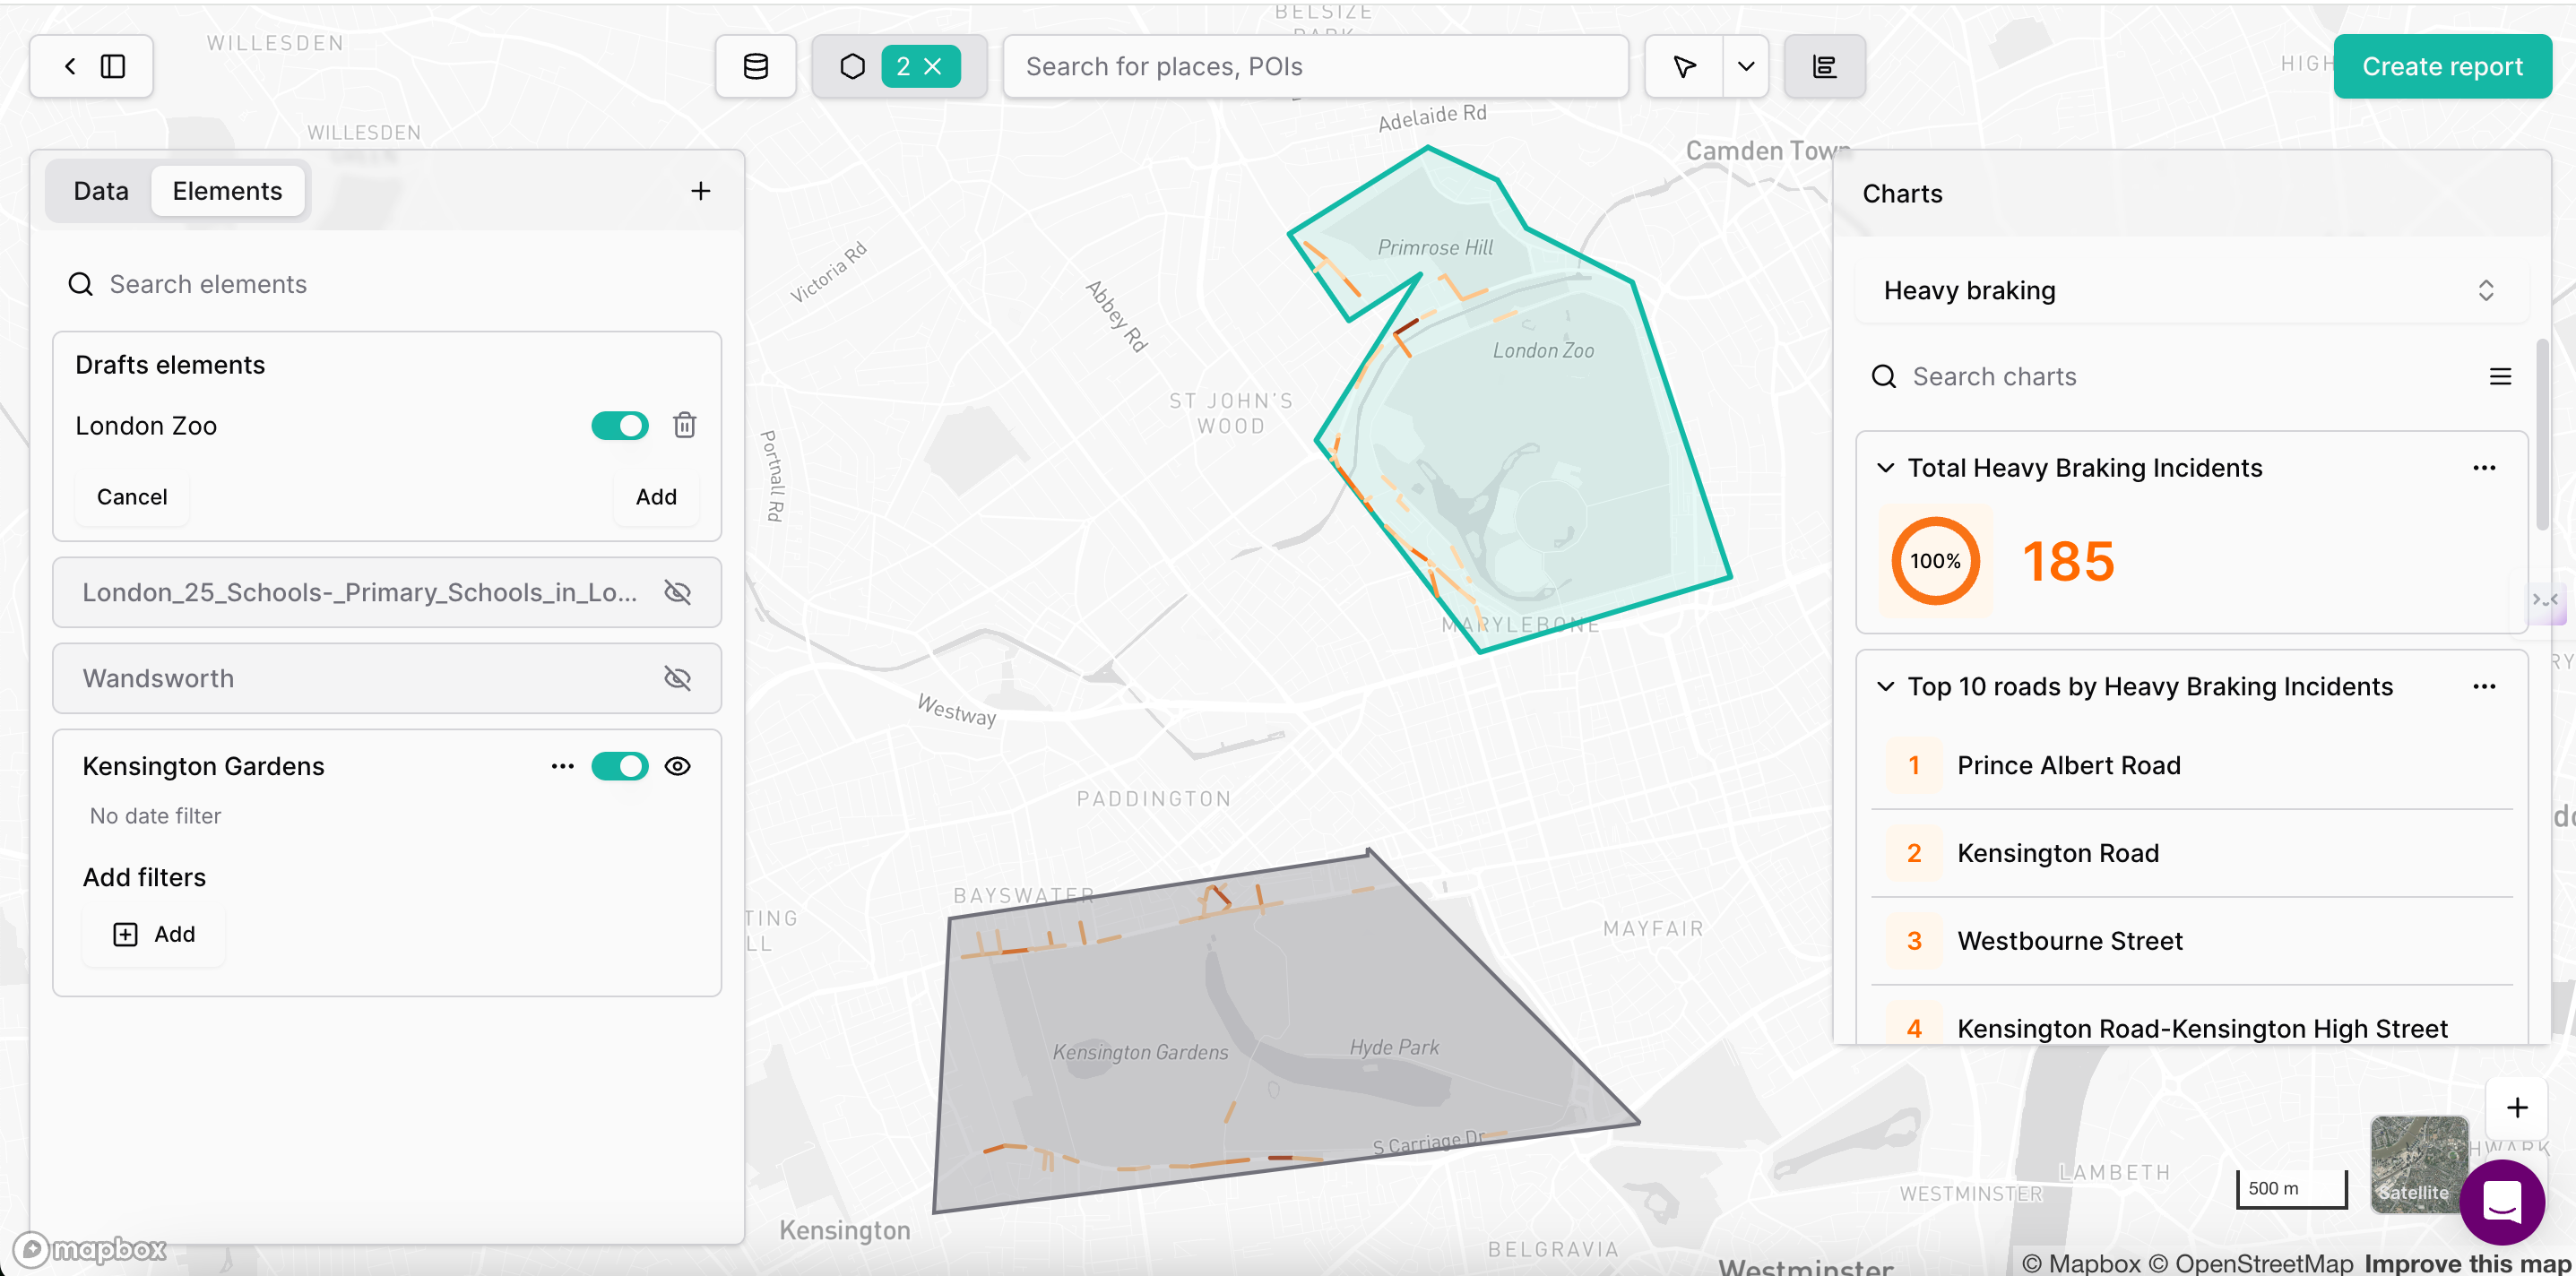
Example 2 : Here you can see two elements activated at the same time to trigger your analysis. Widgets will also updated accordingly.
Updated 8 months ago