How to query and visualise streams
The best way to get insights from data
Exploring Your Data with widget builder: Unleashing the Power of Streams
Introduction
In the dynamic landscape of geospatial datasets, harnessing the full potential of your information is paramount. Our innovative feature, widget builder, empowers users to seamlessly create widgets that sit atop their streams, unlocking the ability to derive insights from complex data sets effortlessly. In this knowledge base article, we'll delve into the versatile capabilities of widget builder, showcasing how it simplifies the process of navigating and visualizing geospatial datasets with time, space, and intensity dimensions.
Widget creation experience
You can start building the widget by going to the Report page. Just click on the "+" button as usual to create a widget, you will see a popup asking you how you want to proceed
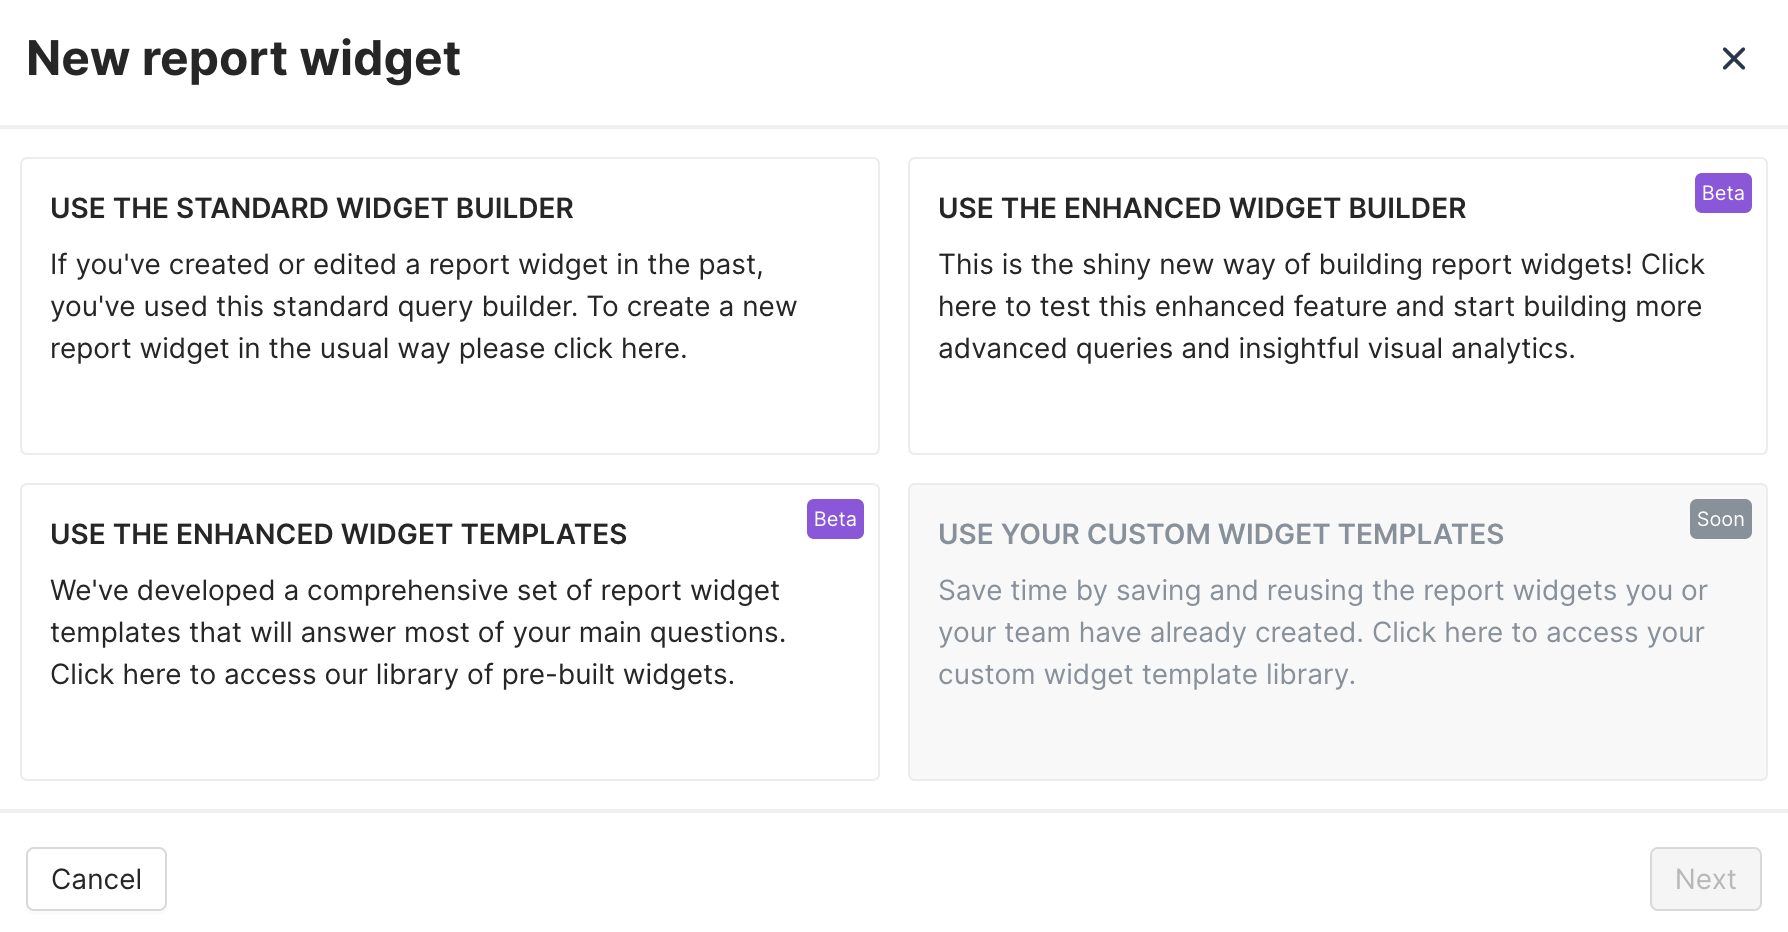
Here you have basically 3 choices
- Use the standard creation flow as for the existing widget
- Use the enhanced widget builder to directly craft it by starting from scratch
- Use the widget templates, which are a list of predefined widgets from the top 10 questions you might have regarding geospatial datasets
Understanding Streams
Streams, at their core, are geospatial datasets enriched with time, space, and intensity attributes. widget builder allows users to select from a variety of streams within their scope, with an initial focus on providing hourly fleet metric information. This sets the stage for users to explore and analyze intricate datasets, enabling them to make informed decisions.
Tailoring Your Analysis
Widget builder excels in offering users a rich set of options to customize their analysis:
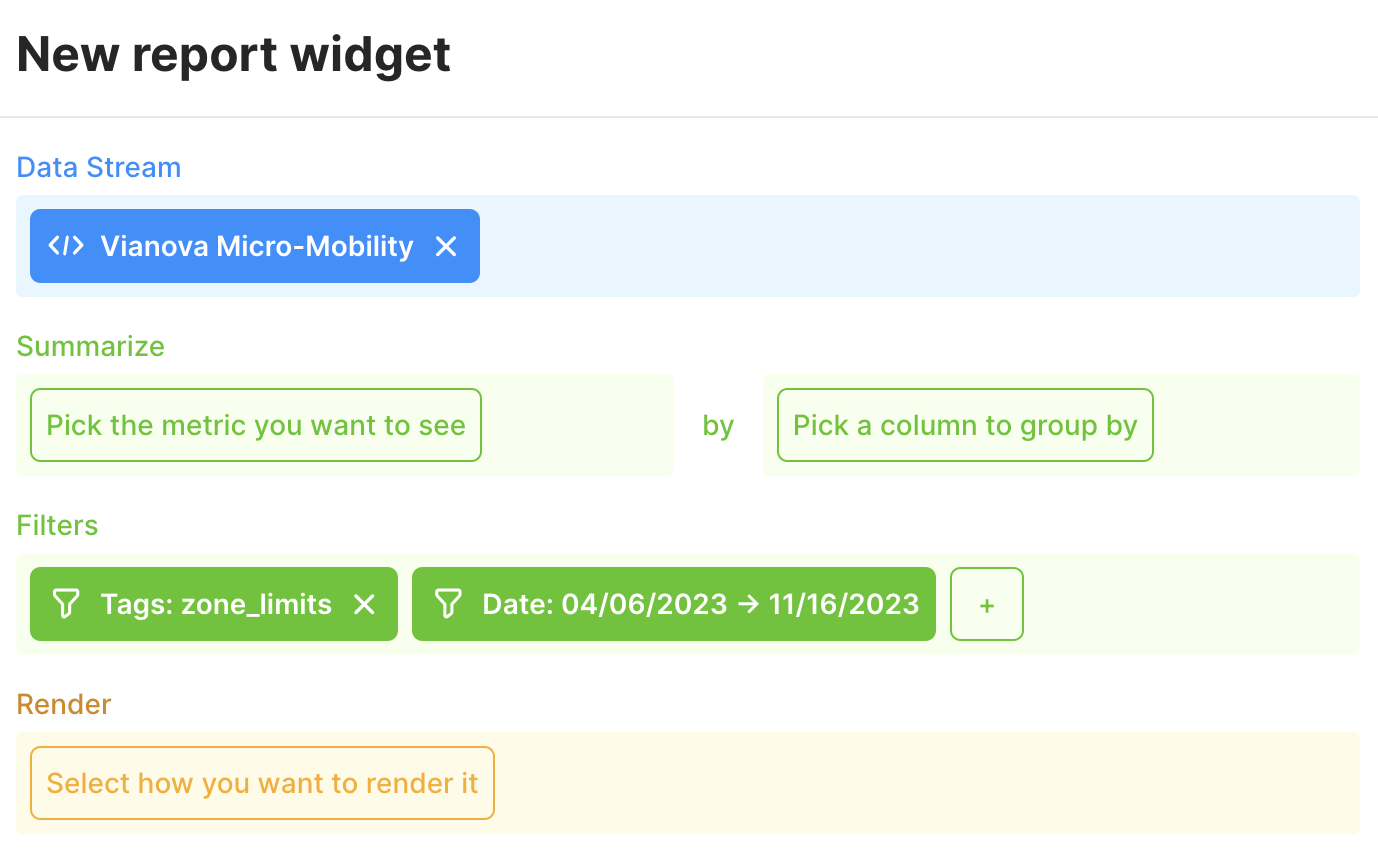
1. Streams selector
You will have to choose a stream from the existing list, by default scopes come with 2 streams
- the "Zone" streams with represent the list of all your zones from the Zone page
- the "Vianova Micro-Mobility" which is corresponding to the Metric API but as a stream
Stream listIf you think a stream is missing from this list or you would like to add one, please reach out to the support.
2. Mathematical Operations (Summarize)
Users can apply different mathematical operations to the intensity column, tailoring the analysis to their specific needs. This flexibility ensures that the data is manipulated in a way that aligns with the user's objectives.
3. Aggregation Options (By)
Users have the freedom to choose how data is aggregated by grouping it based on time, intensity, and space. This allows for a comprehensive exploration of the dataset, providing insights into patterns and trends that may otherwise go unnoticed.
4. Advanced Filtering (Filters)
Widget builder facilitates precise data filtering, allowing users to narrow down their analysis based on specific criteria such as date, day of the week, hour of the day, tags, or zones within a tag. This level of granularity ensures that the insights derived are highly relevant and actionable.
5. Diverse Rendering Options (Render)
To cater to varied preferences, widget builder offers multiple rendering types. Users can choose between a raw table, line graph, bar graph, or pie chart based on their preference and the nature of the data. This ensures that the visualization aligns with the user's analytical goals.
Unleashing the Power
The amalgamation of these features makes widget builder an exceptionally powerful and intuitive tool for extracting fast and meaningful results from complex geospatial datasets. Users can seamlessly navigate through their data, customize their analysis, and visualize the findings with ease, making data exploration a truly enriching experience.
Introducing Query Templates
In our commitment to enhancing user efficiency, widget builder introduces Query Templates. These predefined queries serve as shortcuts, allowing users to obtain results even faster without the need for extensive query crafting. This feature streamlines the analytical process, making it accessible to users of all levels of expertise.
Conclusion
In conclusion, widget builder stands as a cornerstone in the realm of geospatial data exploration. Its intuitive interface, coupled with a robust set of features, empowers users to unlock the full potential of their datasets. Whether you are a seasoned analyst or a novice user, QueryBuilder offers a seamless and powerful solution to derive meaningful insights from your geospatial data.
Streams Query APIPlease refer to our API recipe if you want to make direct call to the Query API without using the widget builder
https://help.vianova.io/recipes/how-to-upload-a-stream-source-and-query-the-data
Widget builder was part of the release 99
Updated 8 months ago