Importing and Exporting Data
Importing Data as a Static Layer
Cityscope enables the user to add in additional contextual layers to better understand the data feeds they see on the Activity page. Almost any data can be added:
-Traffic counts
-Crash incidents
-Demographic information
-Complaints from users or the general public
-App opens
-Parking availability
-Data from after-market sensors, for example gyroscopes which capture tipped devices or heavy breaking events
-Curbspace utilization
Data is private to your organization- only people who have access to your organization have access to the data layers you add. Only an admin can create and delete layers.
Begin by selecting "Layers" in the Activity Page, selecting the "plus" icon in the bottom left. You will be given the option to browse existing files or to add a file of your own.
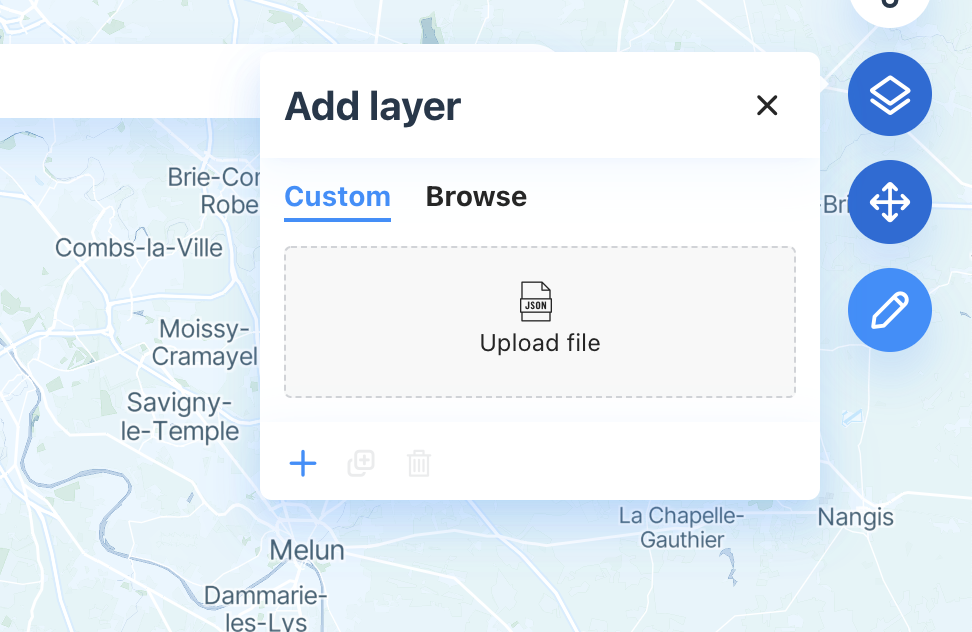
In order to upload your file:
-It must be in a GeoJson format. We recommend using a simple web editor to convert the file from a CSV or a Shapefile.
-The file must have variables as a number (not as a string)
-The file must have fewer than 50,000 rows (contact [email protected] with a larger file)
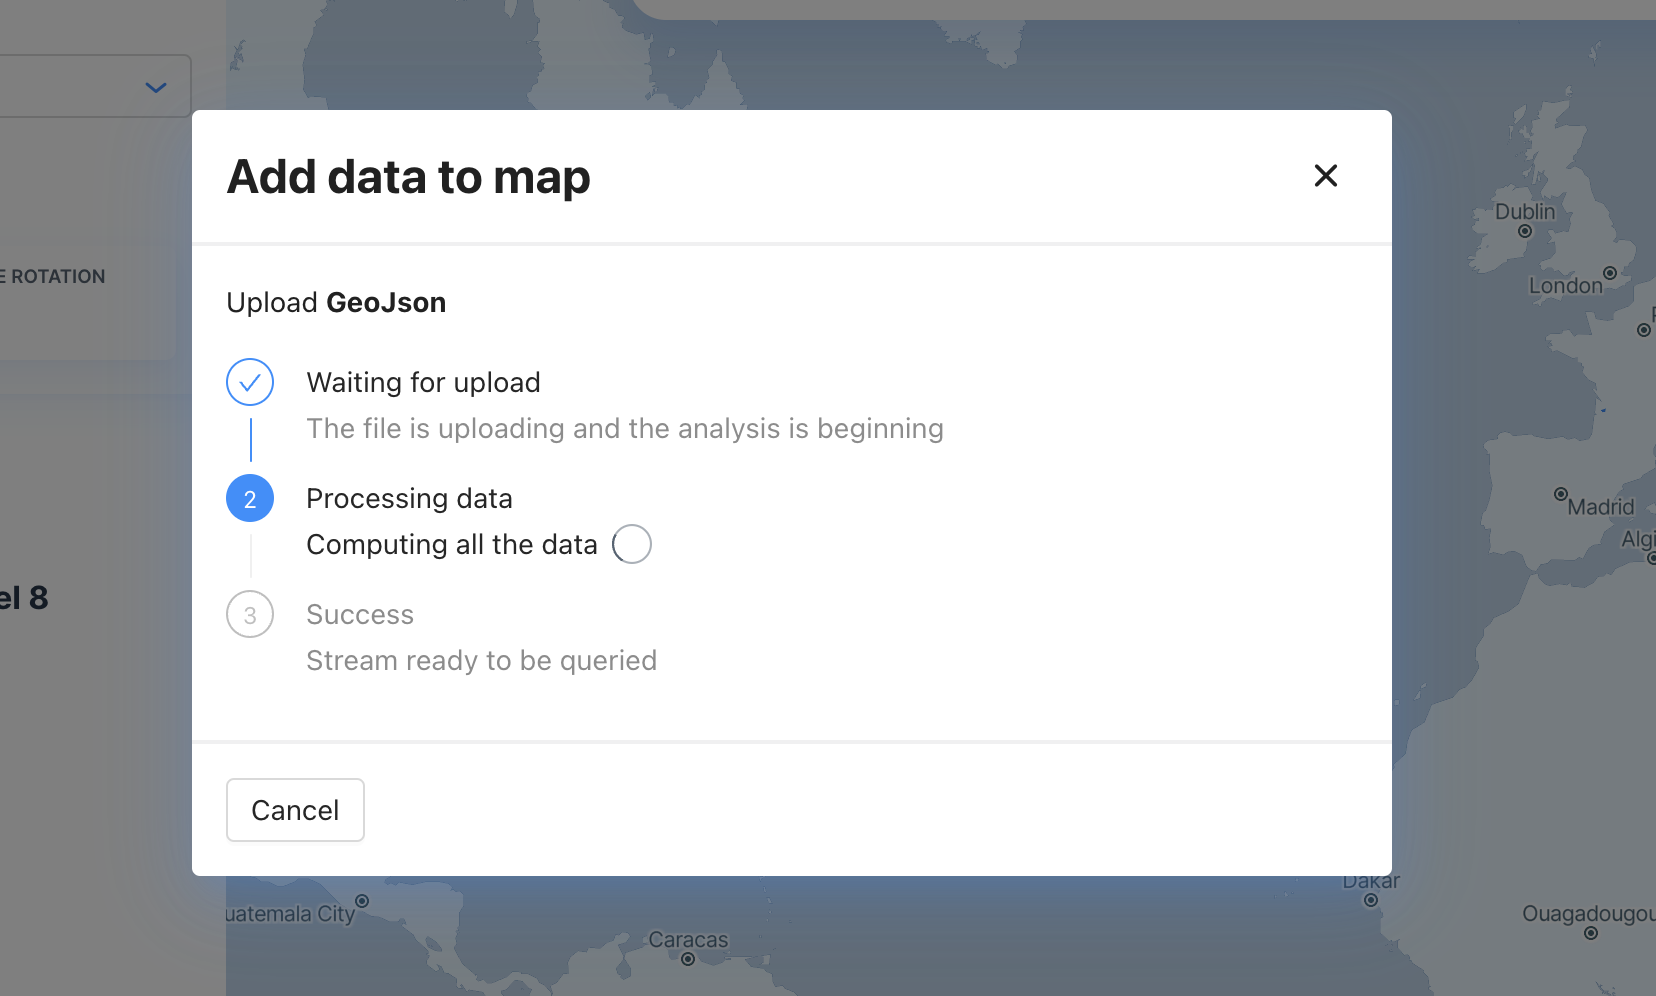
After the file has been uploaded, a process will run for several seconds to analyze and import the file.
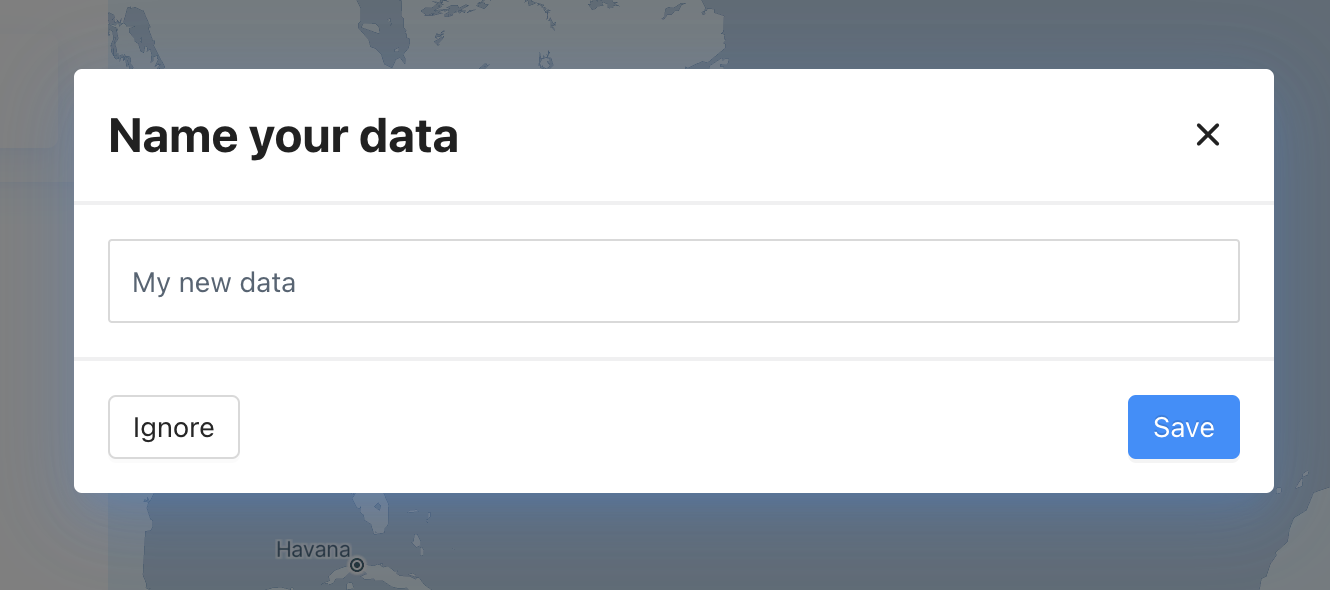
Once the upload is complete, you will have the option to name the layer.
Your custom layer will be available to you in the layers area. Clicking on the square next to the layer name gives you the ability to customize its visualization.
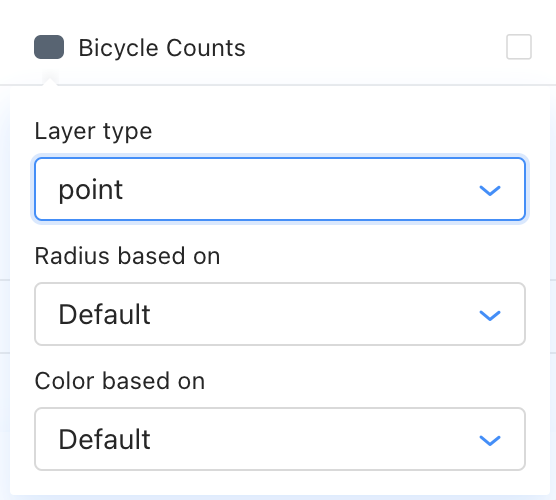
Layer Type- The way the data is represented- as a set of points, a heat map, or a cluster
Radius based on- The dimension of the point will be based on a variable of your choice from the data set
Color based on- The color of the point will be based on a variable of your choice from the data set
You also have the ability to "filter" data by a variable. You can either use a distribution (for example only show data below the mean) or a value (show only values greater than X).
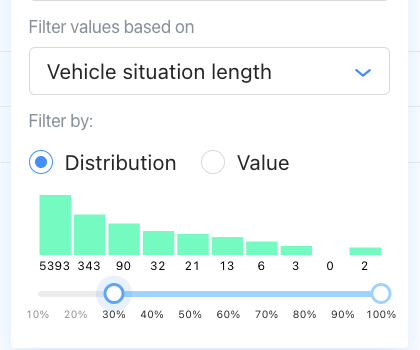
In the first version of the tool, Cityscope does not support time series- all information will be displayed as a static layer. It also does not support aggregation or spatial operations- both features planed for future release.
For examples of how customers are using Bring Your Own Data, visit this page.
Exporting Data
Export is an incredibly useful tool for producing new insights from your data. Virtually any statistic available in Cityscope is available for export in either JSON or CSV format, allowing you the ability to add to your own statistical analysis tools or to design your own tables and charts.
Export has four steps:
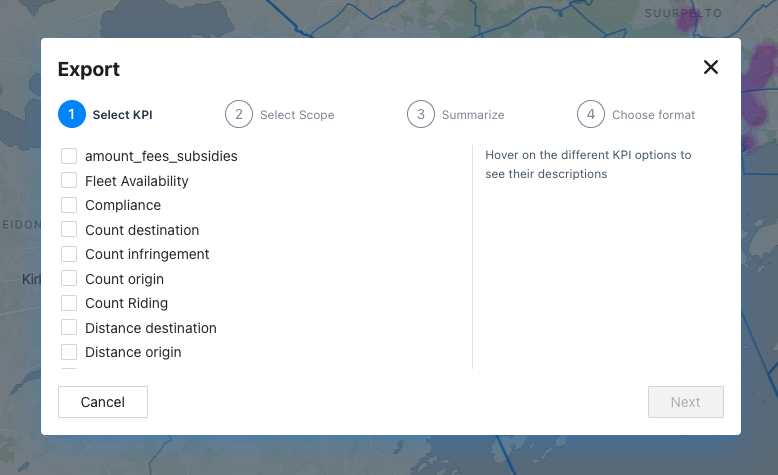
The KPIs available in Cityscope are presented here. Popular KPIs include "Fleet Size", "Count Origin" (Which is presented in Cityscope as the number of trips), and Vehicle Rotation. For a full definition of each KPI, read this Knowledge Base article on definitions.
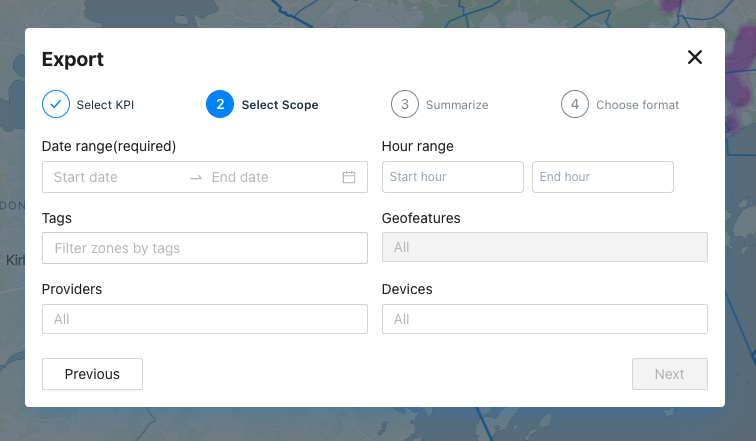
Here you have the ability to select the precise information you are looking for. You can select:
- One day, or a range of dates
- A specific time range (if not selected, will default to the full day)
- Tags (if not selected, will default to the entire city)
- Geofeatures (if you add a tag, you will have the ability to limit Geofeatures to only those you are interested in, for example specific subdistricts or custom zones)
- Providers (if not selected, will default to all providers)
- Devices (if not selected, will default to all device types)
We do not recommend selecting more than 1 or 2 metrics at a time
You cannot mix metrics and compliance KPI, it will lead to a lot of 0 in your exported file
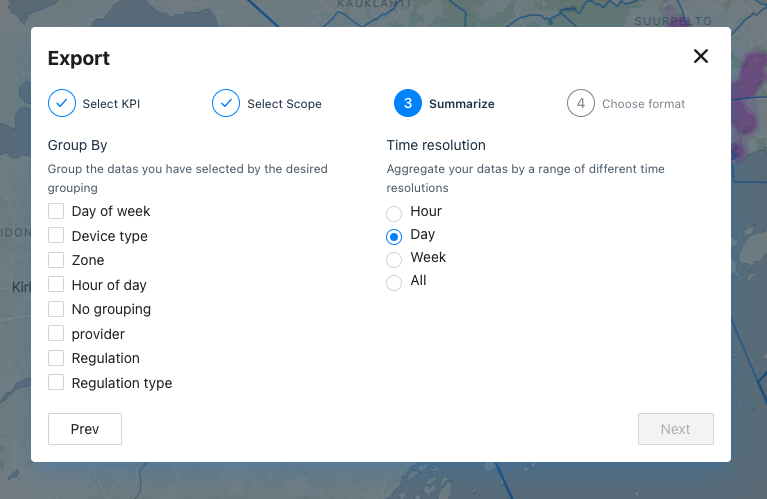
You may group data by a different category for better sorting in the future. For example, if you group data by provider, you will be able to view the KPI with each provider's data separated out. This feature allows for quick analysis using a pivot table in your spreadsheet editor of choice. Select "no grouping" if you do not need further grouping.
You can also select the level of aggregation you prefer. Data will always show at an hourly count or average as this is the fundamental building block of our data. If you have selected a different time resolution level than hourly and are interested in the aggregated total, simply multiply that number by the hours in the time period (for example, multiply the result by 24 to get the total number of trips which occurred each day.
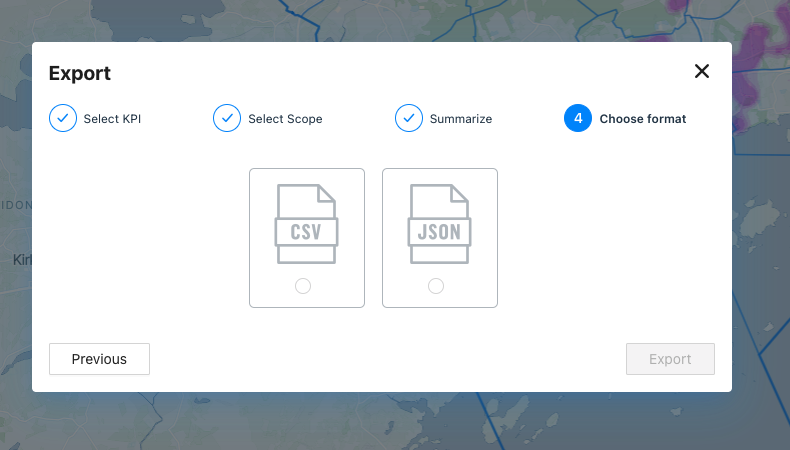
You have the option of downloading your data either as a CSV file (for the purposes of editing in Excel, Google Sheets, or Numbers), or as a JSON (for the purposes of using a Python library or programmatic parser). Both types of files will be exported as a .ZIP file with a README document explaining the various filters and features of the export.
We're constantly improving the Export function, and so certain aspects of the process may change over time. We will make sure this page stays up-to-date with the most current version of the export process, but as always, feel free to reach out to us if you have any questions!
Updated 3 months ago
