Layer Management
he VIP platform serves as a centralized hub for diverse mobility intelligence, offering an extensive array of data layers that power comprehensive transportation analysis.
Overview
Data layers in VIP represent different types of mobility information, ranging from traffic patterns and driving events to risk assessments and accident data. Each layer contains specialized information that can be visualized on the map and analyzed through various tools.
Accessing Data Layers
To access and manage data layers:
- Navigate to the left sidebar panel
- Select the "Data" tab (as opposed to "Elements")
- Browse the available data layers in the list
Working with Data Layers
Selecting Layers
Click on any layer in the list to select it
The eye icon indicates whether the layer is currently visible on the map
Toggle visibility by clicking the eye icon
Multiple layers can be activated simultaneously for comparative analysis
Searching for Layers

- Use the search bar at the top of the data panel to quickly find specific layers
- Search by name, data type, or keywords related to the data content
- Results update dynamically as you type
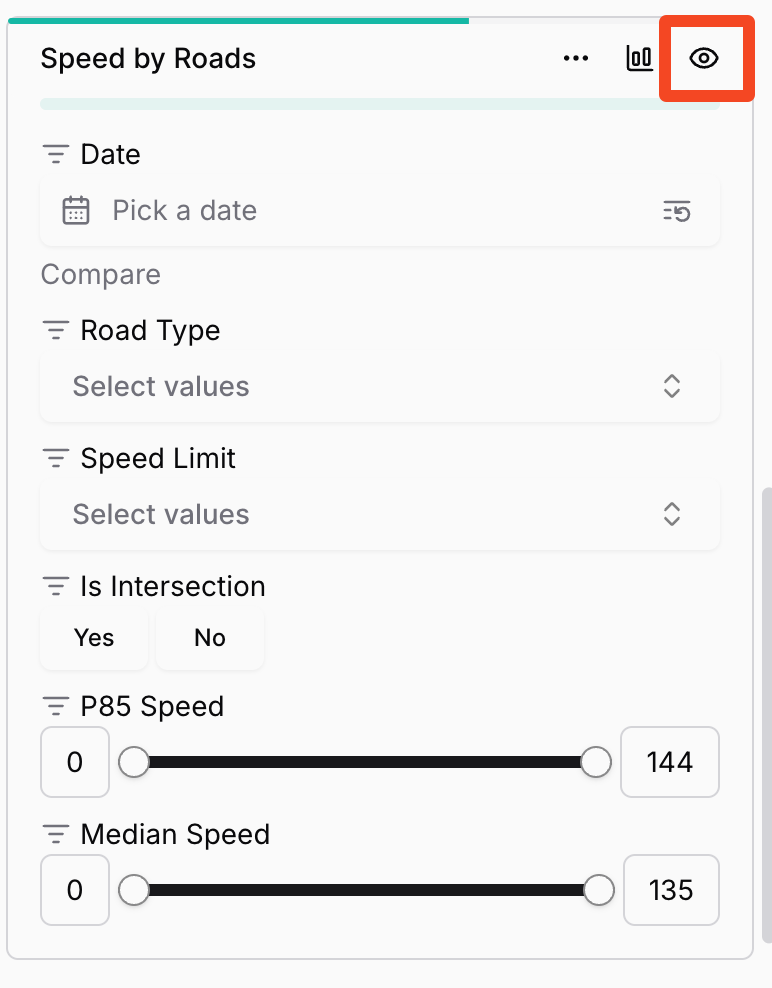
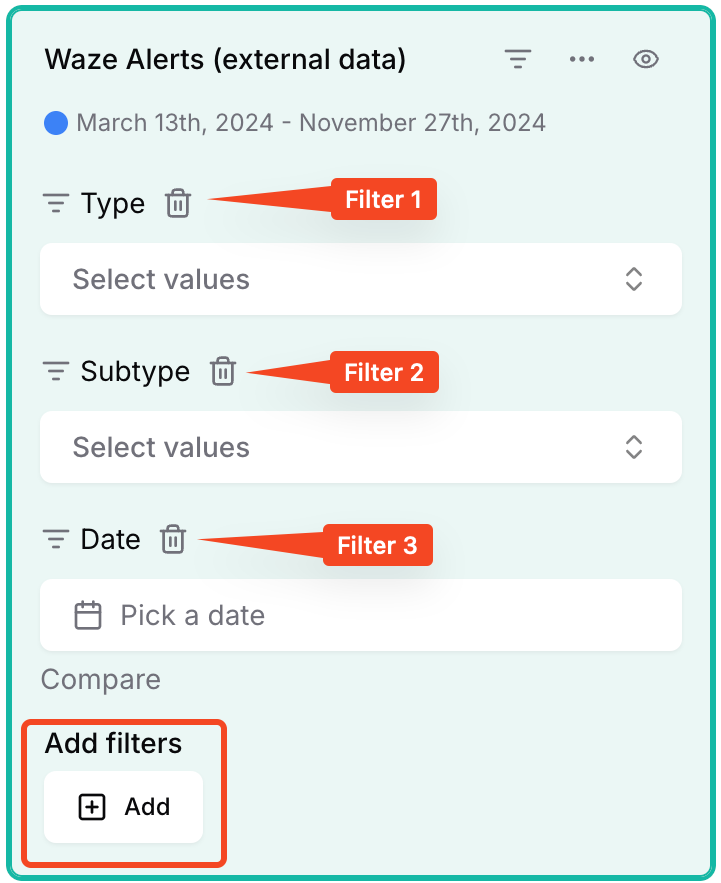
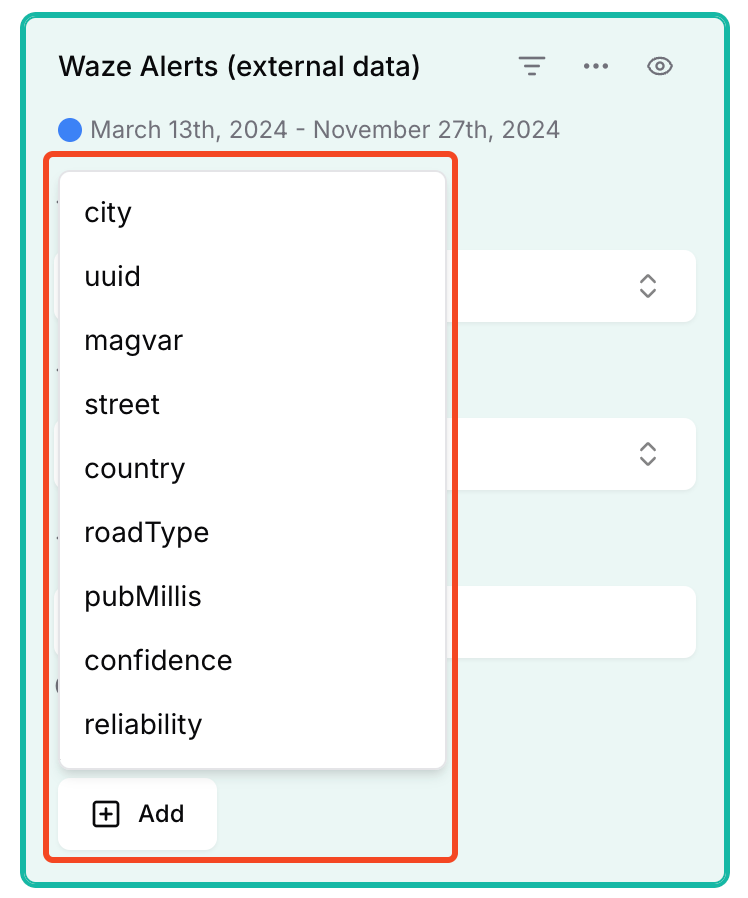
Filters on Layer
The VIP platform allows users to upload and integrate their own datasets as custom filters, enabling more specialized and localized analysis.
You can select as a filter all the columns of your data set by clicking on "Add filters" buttom.
Edit Data Layer
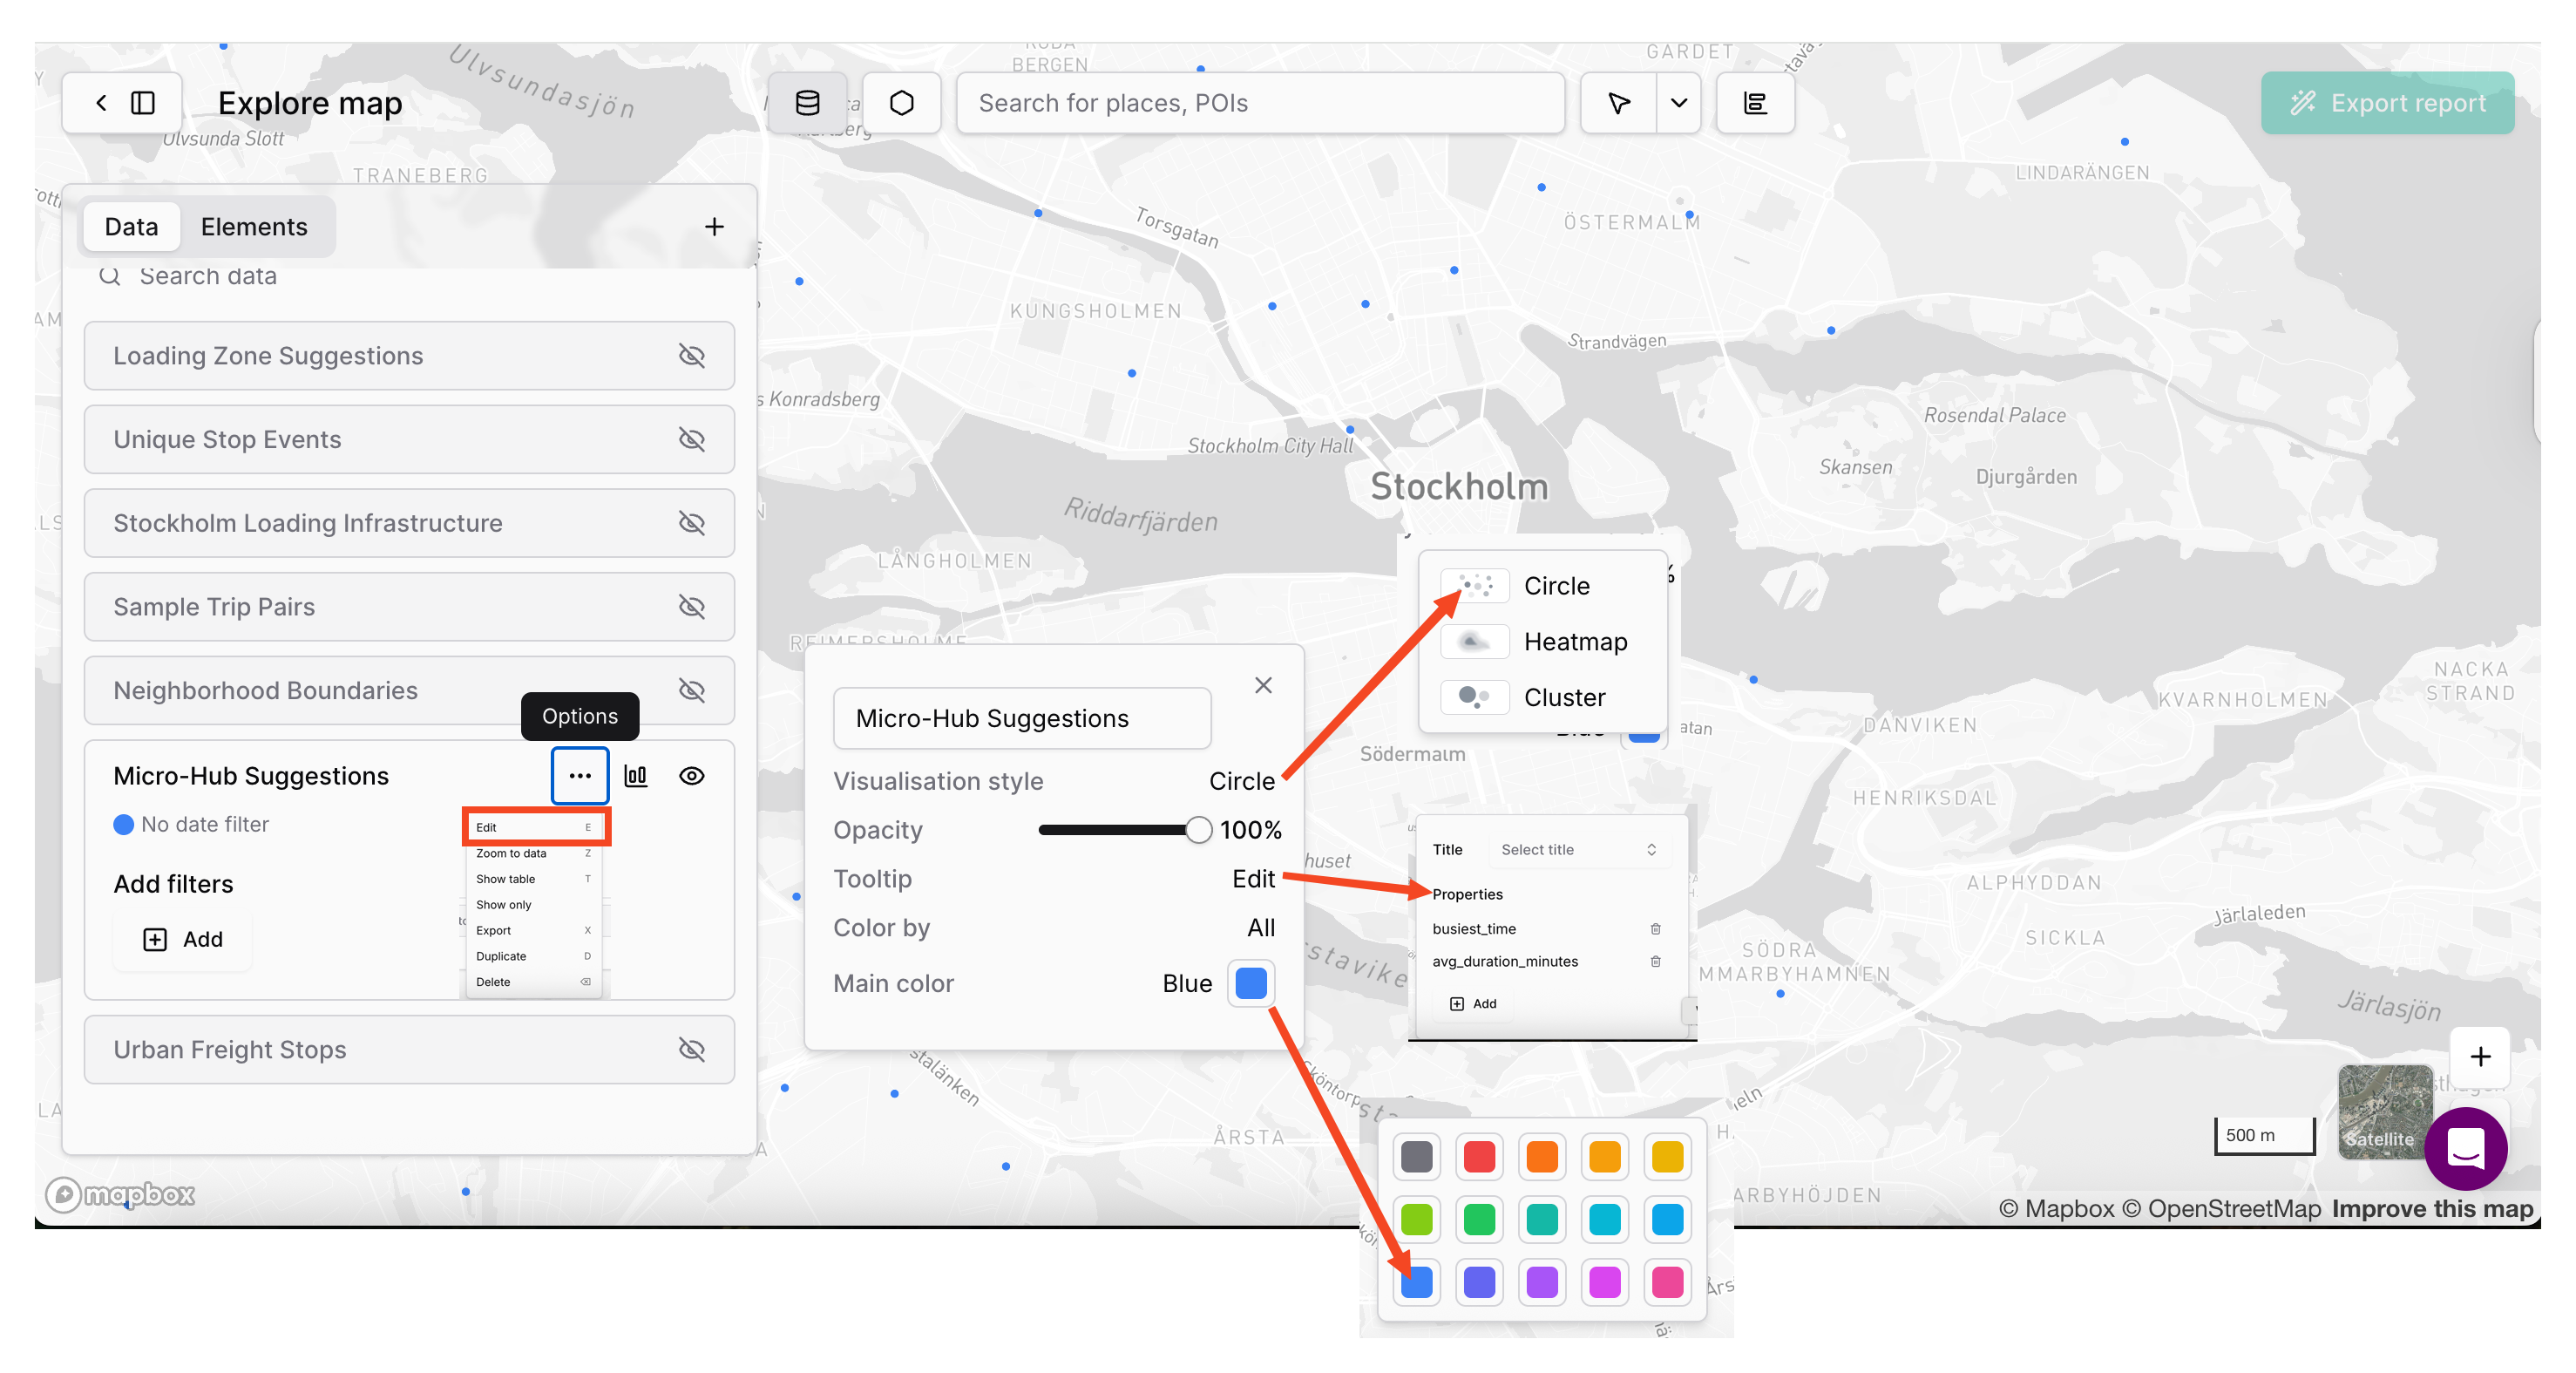
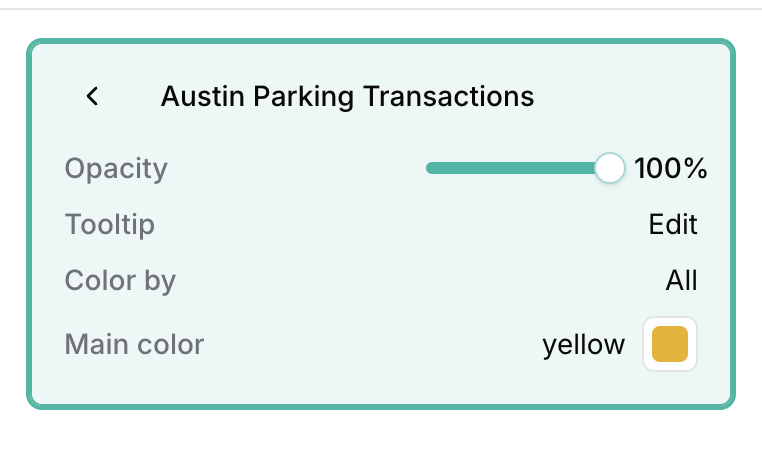
Color and visualization styles can be edited and will remain with the layer until changed
A tooltip can be customized to visualize data attributes when an element is selected on the map. Tooltips can add additional information for a user reviewing the data.
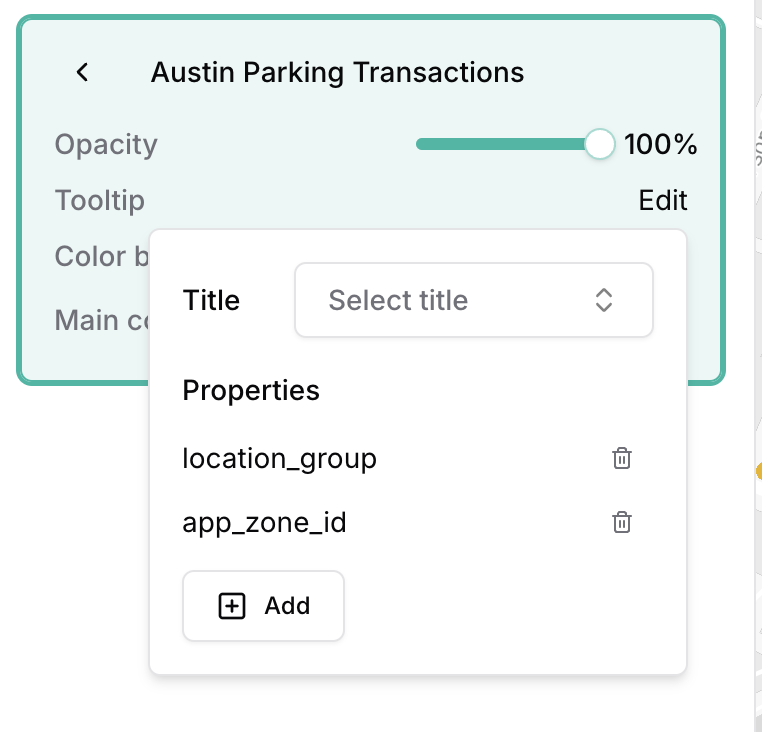
Tooltips can be customized with any data attribute available in the dataset (ie available as a column in the data table)
Multi-layer Selection
The platform allows you to select and display multiple data layers simultaneously:
- Click on the first layer you want to display
- Click on additional layers to add them to your view
- Use the eye icon to toggle visibility of individual layers
- Compare different data types in the same geographic context
When multiple layers are active:
- Data from all visible layers appears on the map
- Widgets and charts will update to show relevant metrics of the layer you last click on
- Tooltips will display information from the layer being clicked
Updated 4 months ago