The Zone Page
Introduction to the Zone Page
The Zone Page is a resource library for all of the geographic boundaries you may choose to use in Cityscope. You can review all of the existing shapes and add and categorize new ones here.
Who is the Zone Page For?
The Zone page is for anyone trying to produce bespoke analysis, particularly for geographic areas that are non-contiguous (for example, a boundary around every metro stop) or are not the same shape as the existing districts or sub-districts (for example, an area of a few square blocks, or a zone covering one third of the city).
How to Build Zones
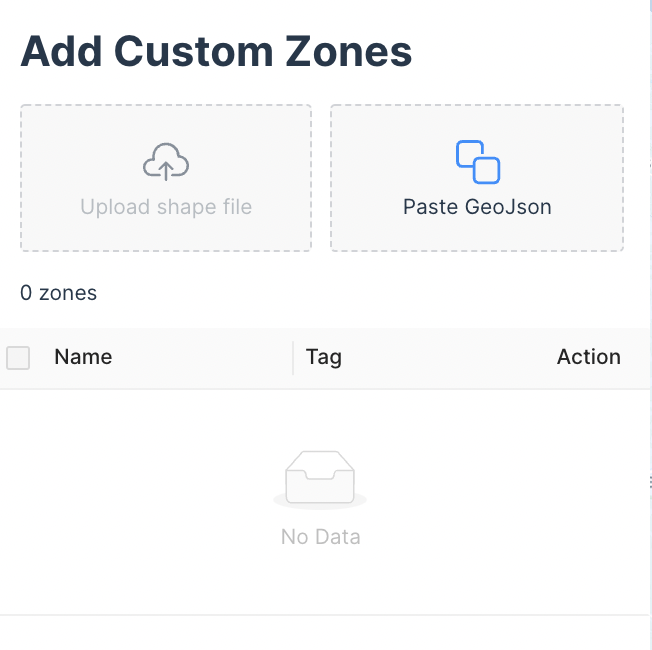
Like Regulations, Zones can be created either by drawing them using the drawing tools, or by uploading a GeoJSON.

All zones must have a tag associated with them. Tags can be custom, for example, you can name your zones something like "Study area" or even "Mark's Sample Study Area".

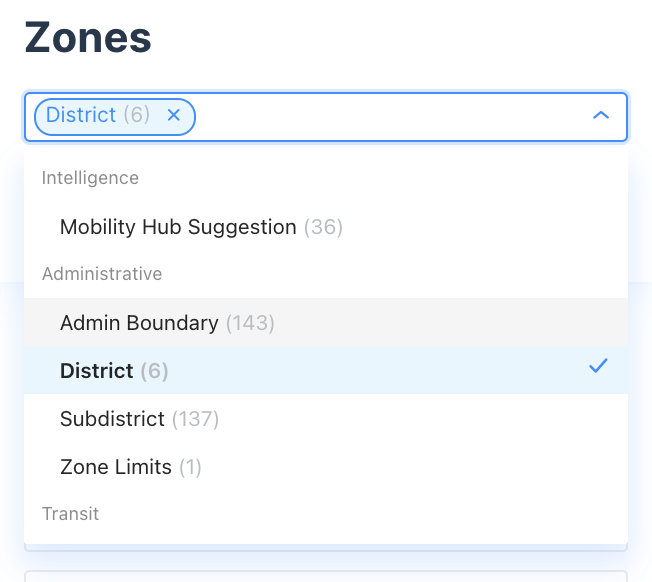
Your city will likely come pre-populated with some zones, such as districts and sub-districts, as well as "Zone Limits" (the entire city's geography). You will see the custom tags at the bottom of this list.
Modifying your GeoJSONNote that you may need to modify your GeoJSON file slightly in order to achieve your desired outcome. We recommend a free GeoJSON editor such as GeoJSON.io
One common need is to separate a single GeoJSON into multiple polygons (for example, so that each mobility hub location is treated as a separate feature). In GeoJSON.io, you can do this simply by selecting "Meta"-> "Flatten Multi Features"
Zone Data
The Zone page does not provide data about the zones, only the zones themselves. If you want to view data, you can visit either the Activity Page (for specific queries) or the Report Page (for a trend analysis).

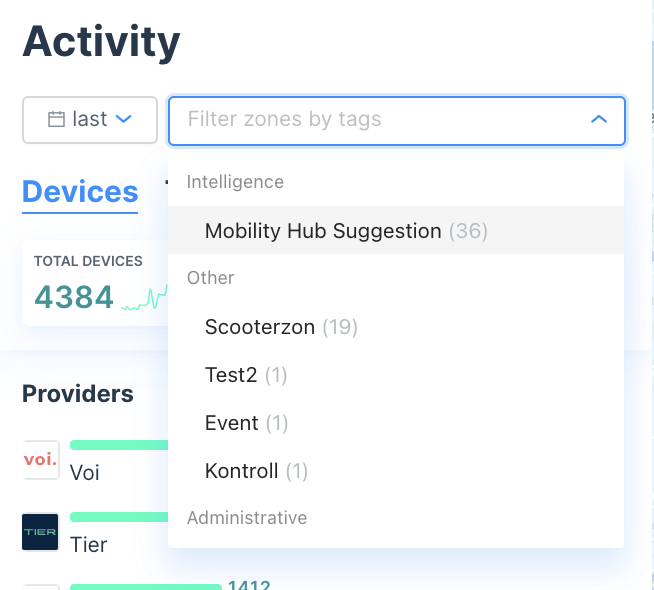
You can filter by tags in the top left of the Activity Page

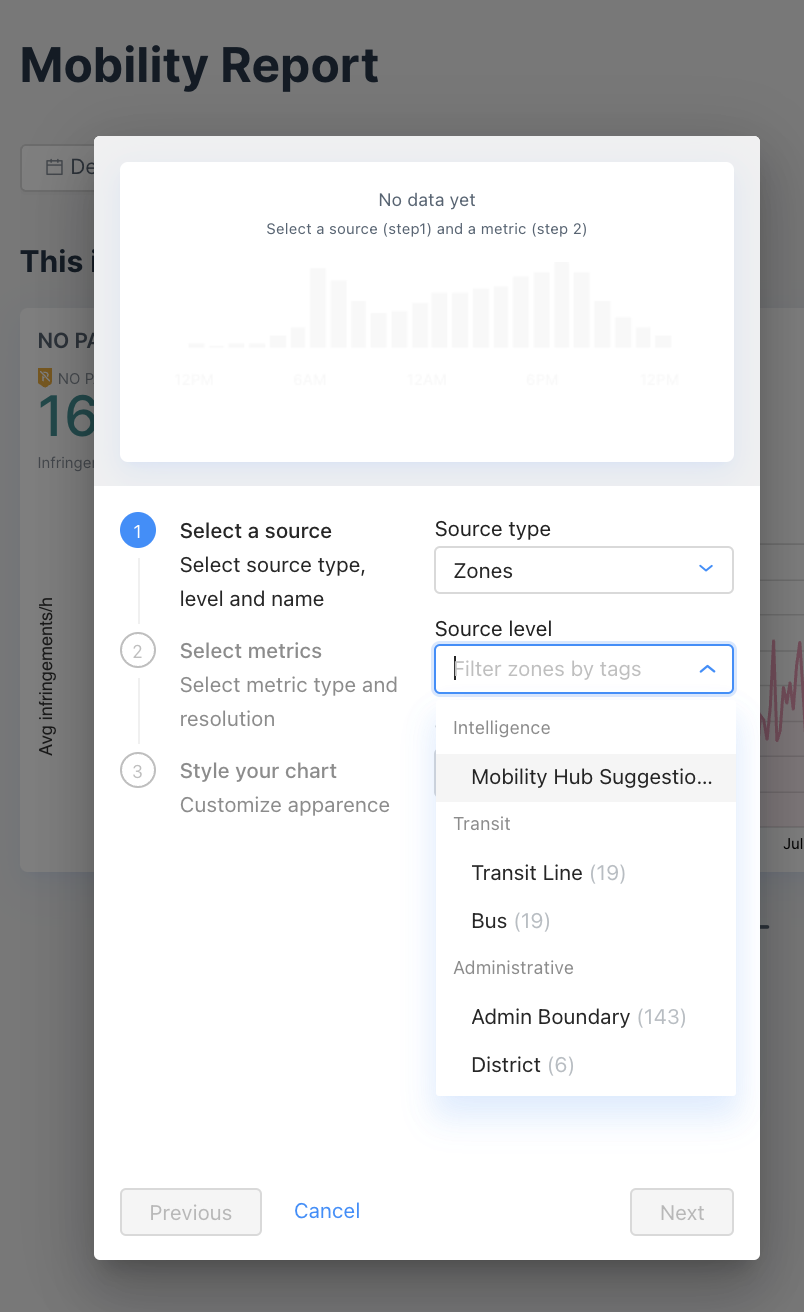
You can create widgets based on a specific zone, or all zones.
Updated 3 months ago
