Understanding the Road Safety Rank
Vianova has recently begun providing a road safety score to clients in certain markets. Here you can learn about the data that goes into the score, how to use the layer, and how to interpret the results.
Collecting Data For Road Safety
Vianova's Road Safety ranks are calculated based on several component features, each featuring a specific location, represented by a latitude and longitude coordinate. Data primarily comes from three distinct sources:
- Local or national governments, which maintain data records on historic collisions
- OEMS (Original Equipment Manufacturers) or Tier 1 suppliers (automotive technology companies), which provide anonymized data about driving behaviors
- Shared mobility providers, who provide data regarding shared mobility usage
Vianova uses a proprietary algorithm to assign, or "snap" each of these location points to the most appropriate road segment. We identify roads using Open Street Map , a crowd-sourced but highly reliable data set of the world's roads, including information such as the name, the posted speed limit, and the type of road. In order to ensure reliable results, Vianova slices roads into approximately 100m units for easy comparison, though some particular segments may be shorter or longer. Vianova also applies certain business rules to the data to remove outliers (for example, removing bicycle trips assigned to motorway road segments).
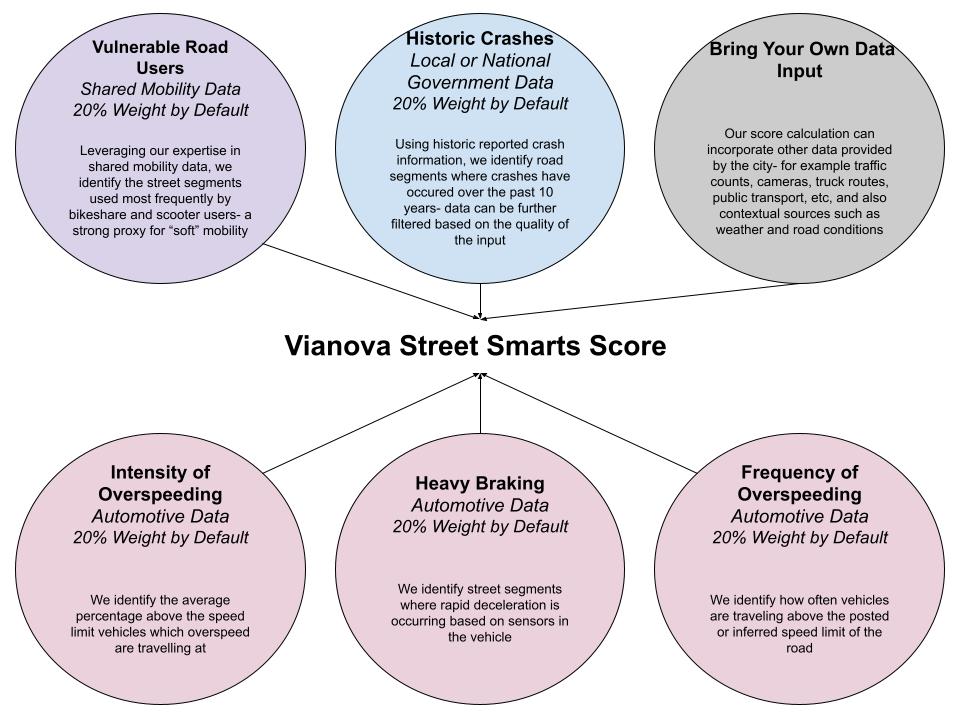
A road safety rank is currently calculated by evenly weighting the five component metrics:
- The count of collisions occurring on or near the street segment (using the last five years of data, if available)
- The share of vehicles travelling above the speed limit (by default Vianova uses 18 months of data)
- The median percentage above the posted speed limit that those over-speeding vehicles are travelling (again, using 18 months of data)
- The count of "heavy braking" incidents, where braking exceeds normal pressure and speed (again using 18 months of data)
- The number of shared mobility trips (bicycles and scooters) which occur on the road segment (using six months of data)
Data which is "counted" (such as collisions) are "normalized" for the total number of observations, and the length of the road segment. In other words, the objective is to assess risk adjusted so that long road segments or busy road segments are not disproportionately represented.
Errors may occur with such a large data set, but the vast majority of observations will be assigned to the correct road segment. The most frequent errors to occur include incorrect attributions of data points, and Vianova works to ensure that these are minimized.
As we improve the feature, we will have the ability to add additional components to the ranking, and to apply different filtering of the data based on certain characteristics (such as weather, time of day, or road condition).
Understanding Representativeness of the Data
Vianova works with data providers to ensure appropriate coverage of observations. With the growing use of connected vehicles, the fleet coverage will continue to increase. Vianova tries its best to produce robust coverage through several techniques:
- Working with multiple providers
- Picking providers with a range of vehicle types and driver profiles
- Excluding streets where the observation is too low to draw a conclusion
Reading the Road Safety Score
Vianova combines the data provided by the individual fields into a set of scores for specific road segments or intersections. Using historic crashes as an example, let's evaluate how a component risk is created:
- The total number of crashes is counted
- The crashes are each assigned to one road segment or intersection
- The number of crashes is normalized against the total number of observations for the segment
- The normalized score is ranked against the other segments
The score can be represented in three ways: the rank, the percentile, and the category. These three measures contain identical information, but offer different levels of granularity to the user.
| Rank | Percentile | Category | |
|---|---|---|---|
| Description | The absolute ranking of a street segment, when compared to other street segments. | A normalization of street segments, compared to the total universe of segments | A one to five normalization of the street segments |
| Rationale | The rank is a constant sorting of street segments which remains consistent even as certain segments are excluded through filtering | Provides moderate precision about the relative presence of a variable | Serves as a quick shorthand for the relative presence of a variable compared to others |
| Risk is found with... | Lower values | Higher values | Higher values |
| Minimum Value | 1 | 1 | 1 |
| Maximum Value | Dependant on the number of road segments | 99 | 5 |
Users are able to change which components are displayed via the settings of the layer. This screen provides the ability to create new lines in the tool-tip, including pre-figured tool-tips.
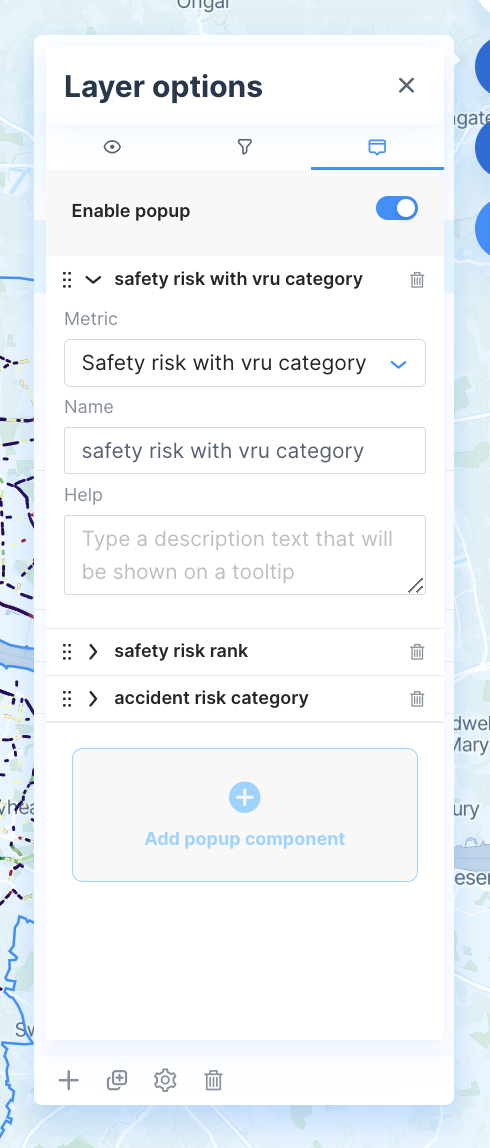
The layer options page allows the user to create new pop-up components.
Vianova also provides a standard Overall Risk Scorewhich takes the risk scores of the component elements (Collisions, Harsh Braking Events, Overspeeding Intensity, Overspeeding Frequency, and Presence of Vulnerable Road Users) and combines them in equal weight.
The Overall Risk score can also be represented as a rank, percentile, or category. The weighting of the individual elements of the overall risk score cannot be modified by the user, but roads can be excluded from the ranking by adjusting the histogram of the various components. For example, if the user were to set the filter for "Collisions" to the top 10% of roads, they would see the highest ranked roads which also meet the criteria of "within the top 10% of collisions.
What does a "rank" mean?
Predicting collisions is an extremely imperfect science. There are many factors that contribute to a collision which are difficult to quantify- the conditions of the road, the weather, the attentiveness of the parties on the road. But by laying separate data sets on top of one another, we can do our best to identify the potential of compound risks on particular street segments.
The risks provided are meant to give cities, fleet operators, and others information to make better decisions. A rank identifies the habitual presence of the ingredients of a potential collision- heavy braking, dangerous speeds, vulnerable road users. It also accounts for the history of collisions on the street- a strong but not deterministic factor that there may be additional collisions. A street segment with a high rank (a low number) is one where the ingredients are present in high doses.
We leave it in the hands of the transportation professionals using this tool to identify the most appropriate intervention for these corridors- whether it's an engineering approach, an enforcement campaign, or educational outreach. Over time, we will be able to update the risk score with fresh information, in order to determine if interventions have been successful at reducing risks.
Updated 8 months ago